In thousands of metric tons
|
Countries |
Jan |
Feb |
Mar |
Apr |
May |
Jun |
Jul |
Aug |
Sep |
Oct |
Nov |
Dec |
2020 |
2019 |
|
Egypt |
771 |
774 |
682 |
664 |
628 |
662 |
534 |
577 |
601 |
670 |
672 |
994 |
8229 |
7,256 |
|
Iran |
2405 |
2064 |
2304 |
2321 |
2368 |
2425 |
2339 |
2337 |
2572 |
2660 |
2575 |
2660 |
29030 |
31,898 |
|
Libya |
60 |
67 |
23 |
- |
47 |
58 |
15 |
30 |
1 |
50 |
70 |
73 |
494 |
606 |
|
Morocco |
- |
- |
- |
- |
- |
- |
- |
- |
- |
- |
- |
- |
- |
0 |
|
Qatar |
230 |
179 |
163 |
49 |
63 |
80 |
78 |
83 |
80 |
48 |
81 |
85 |
1219 |
2,558 |
|
Saudi Arabia |
651 |
672 |
691 |
589 |
545 |
541 |
605 |
590 |
533 |
748 |
720 |
440 |
7776 |
8,191 |
|
Turkey |
3014 |
2851 |
3110 |
2245 |
2272 |
2799 |
3149 |
3268 |
3225 |
3208 |
3220 |
3403 |
35764 |
33,753 |
|
UAE |
303 |
289 |
264 |
115 |
164 |
219 |
229 |
195 |
233 |
192 |
239 |
280 |
2722 |
3,327 |
|
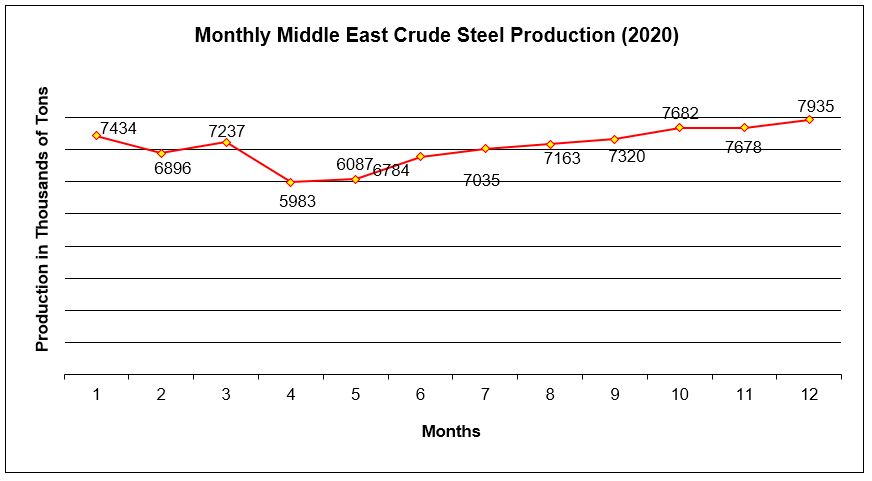
Total |
7434 |
6896 |
7237 |
5983 |
6087 |
6784 |
6949 |
7080 |
7245 |
7576 |
7577 |
7935 |
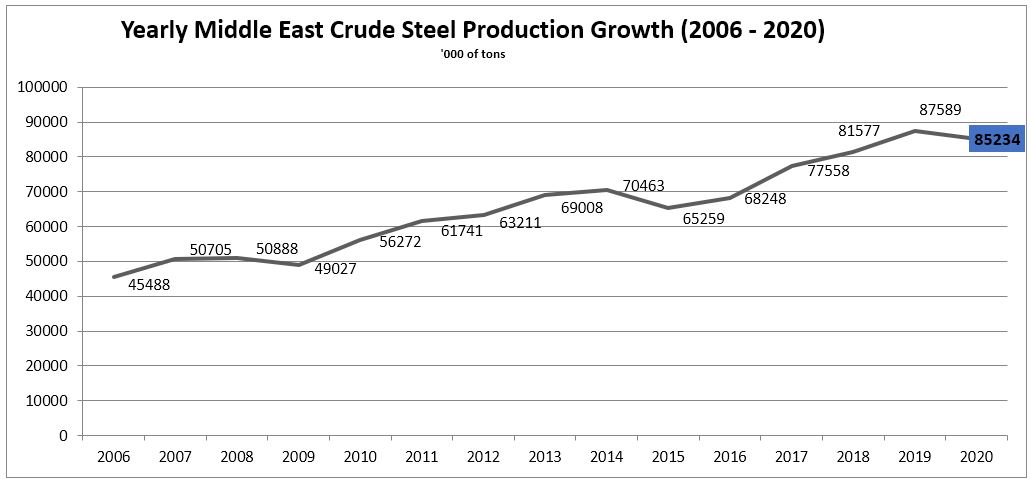
85,234 |
87,589 |
Monthly Middle East Steel Production Difference (December 2019 vs. December 2020)
| Countries |
Dec-19 |
Nov-20 |
Dec-20 |
MoM % |
YoY % |
| Egypt |
574 |
672 |
994 |
47.92 |
73.17 |
| Iran |
2895 |
2575 |
2660 |
3,3 |
-8.12 |
| Libya |
63 |
70 |
73 |
4.29 |
15.87 |
| Morocco |
- |
- |
- |
- |
- |
| Qatar |
186 |
81 |
85 |
4.94 |
-54.30 |
| S. Arabia |
664 |
821 |
440 |
-46.41 |
-33.73 |
| Turkey |
2893 |
3220 |
3403 |
5.68 |
17.63 |
| UAE |
297 |
239 |
270 |
17.15 |
-5.72 |
| Total |
7572 |
7678 |
7935 |
3.35 |
4.79 |
December
- World - Crude steel production reached 160.858 million tons (Mt) in
December 2020, up by 5.8% over December 2019 (YoY).
- Asia
China - Crude steel production was 91.252Mt, up by 7.7% YoY.
India - Produced 9.796 Mt, up by 4.4% YoY
Japan - Produced 7.526 Mt, down by 3.3% YoY
- Middle East
Turkey - 3.403 Mt, up by 17.7% YoY
- US - Produced 6.434 Mt, down by 11.8% YoY
- EU
Germany - Produced 3.137 Mt, up by 10.6% YoY
- Ukraine - Produced 1.906 Mt, up by 22.1% YoY
November
- World - Crude steel production reached 158.3 million tons (Mt) in
November 2020, up by 6.6% over November 2019 (YoY).
- Asia
China - Crude steel production was 87.7Mt, up by 8% YoY.
India - Produced 9.2 Mt, up by 3.5% YoY
Japan - Produced 7.3 Mt, down by 5.9% YoY
- Middle East
Turkey - 3.2 Mt, up by 11.6% YoY
- US - Produced 6.1 Mt, down by 13.7% YoY
- EU
Germany - Produced 3.4 Mt, up by 14.8% YoY
Italy - Produced 2 Mt, up by 3.2% YoY
- Ukraine - Produced 1.7 Mt, up by 30.8% YoY
October
- World - Crude steel production reached 161.9 million tons (Mt) in
October 2020, up by 7% over October 2019 (YoY).
- Asia
China - Crude steel production was 92.2Mt, up by 12.7% YoY.
India - Produced 9.1 Mt, up by 0.9% YoY
Japan - Produced 7.2 Mt, down by 11.7% YoY
- Middle East
Turkey - 3.2 Mt, up by 19.4% YoY
- US - Produced 6.1 Mt, down by 15.3% YoY
- EU
Germany - Produced 3.4 Mt, up by 3.1% YoY
Italy - Produced 2.1 Mt, down by 4.6% YoY
- Ukraine - Produced 1.7 Mt, up by 5.94% YoY
September
- World - Crude steel production reached 156.4 million tons (Mt) in
September 2020, up by 2.9% over September 2019 (YoY).
- Asia
China - Crude steel production was 92.6Mt, up by 10.9% YoY.
India - Produced 8.5 Mt, down by 2.9% YoY
Japan - Produced 6.5 Mt, down by 19.3% YoY
- Middle East
Turkey - 3.2 Mt, up by 18% YoY
- US - Produced 5.7 Mt, down by 18.5% YoY
- EU
Germany - Produced 3 Mt, down by 9.7% YoY
Italy - Produced 1.8 Mt, up by 18.7% YoY
- Ukraine - Produced 1.7 Mt, down by 5.4% YoY
August
- World - Crude steel production reached 156.2 million tons (Mt) in
August 2020, up by 0.6% over August 2019 (YoY).
- Asia
China - Crude steel production was 94.8Mt, up by 8.4% YoY.
India - Produced 8.5 Mt, down by 4.4% YoY
Japan - Produced 6.4 Mt, down by 20.6% YoY
- Middle East
Turkey - 3.2 Mt, up by 22.9% YoY
- US - Produced 5.6 Mt, down by 24.4% YoY
- EU
Germany - Produced 2.8 Mt, down by 13.4% YoY
Italy - Produced 0.9 Mt, up by 9.7% YoY
- Ukraine - Produced 1.8 Mt, down by 5.7% YoY
July