In thousands of metric tons
|
Countries |
Jan |
Feb |
Mar |
Apr |
May |
Jun |
Jul |
Aug |
Sep |
Oct |
Nov |
Dec |
Total |
|
Algeria |
- |
- |
- |
- |
- |
- |
- |
- |
- |
- |
- |
- |
- |
|
Egypt |
605 |
585 |
555 |
463 |
457 |
407 |
426 |
453 |
384 |
324 |
403 |
444 |
5.506 |
|
Iran |
1366 |
1409 |
1315 |
1399 |
1455 |
1428 |
1273 |
1249 |
1337 |
1324 |
1255 |
1300 |
16.110 |
|
Libya |
46 |
17 |
25 |
47 |
49 |
33 |
21 |
3 |
0 |
15 |
36 |
60 |
352 |
|
Morocco |
58 |
41 |
38 |
62 |
52 |
61 |
40 |
65 |
9 |
30 |
30 |
30 |
516 |
|
Qatar |
176 |
209 |
229 |
218 |
239 |
231 |
235 |
224 |
227 |
216 |
192 |
197 |
2.593 |
|
Saudi Arabia |
558 |
509 |
432 |
528 |
551 |
538 |
472 |
498 |
381 |
400 |
390 |
405 |
5.662 |
|
Turkey |
2577 |
2279 |
2694 |
2742 |
2886 |
2809 |
2499 |
2528 |
2454 |
2740 |
2637 |
2671 |
31.516 |
|
UAE |
224 |
216 |
260 |
251 |
266 |
265 |
283 |
190 |
265 |
272 |
250 |
262 |
3.004 |
|
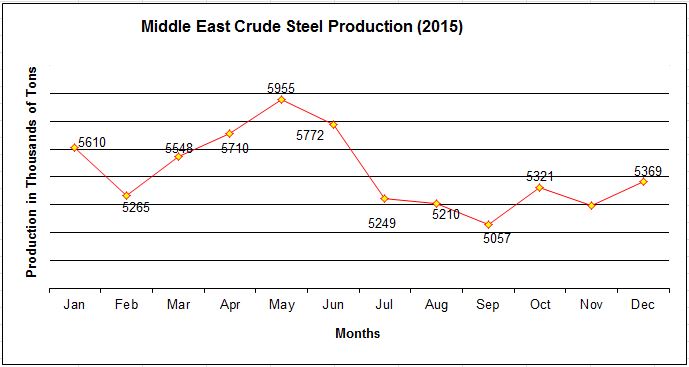
Total |
5.610 |
5.265 |
5.548 |
5.710 |
5.955 |
5.772 |
5.249 |
5.210 |
5.057 |
5.321 |
5.193 |
5.369 |
65.259 |
Algeria did not report any statistics this year to WSA
Annual Middle East Steel Production Difference (2014 vs. 2015)
| Countries |
2014 |
2015 |
% Change |
| Egypt |
6485 |
5506 |
-15.1 |
| Iran |
16331 |
16110 |
-1.4 |
| Libya |
712 |
352 |
-50.6 |
| Morocco |
502 |
516 |
3.0 |
| Qatar |
3019 |
2593 |
-14.1 |
| S. Arabia |
6290 |
5662 |
-10 |
| Turkey |
34034 |
31516 |
-7.4 |
| UAE |
2390 |
3006 |
25.8 |
| Total |
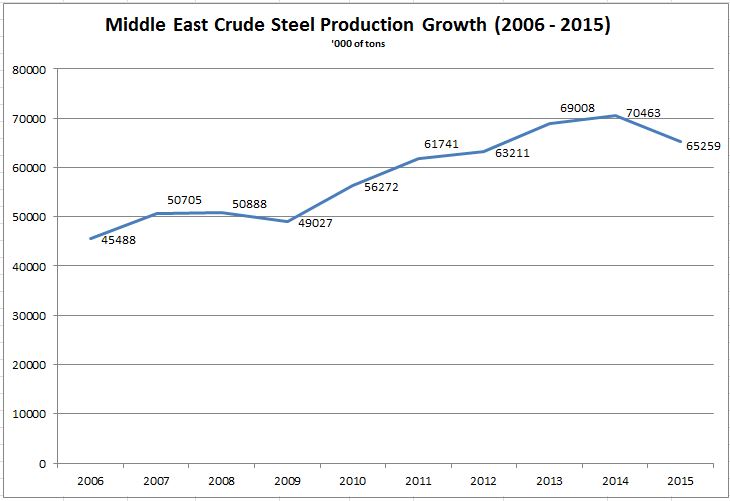
70463 |
65259 |
-7.39 |
Monthly Middle East Steel Production Difference (Dec. 2014 vs. Nov. 2015)
Country |
Dec-14 |
Dec-15 |
% Change |
Egypt |
658 |
444 |
-32.52 |
Iran |
1362 |
1300 |
-4.55 |
Libya |
85 |
60 |
-29.41 |
Morocco |
11 |
30 |
172.73 |
Qatar |
270 |
197 |
-27.04 |
S. Arabia |
547 |
405 |
-25.96 |
Turkey |
2715 |
2671 |
-1.62 |
UAE |
214 |
262 |
22.43 |
Total |
5897 |
5369 |
-8.95 |
December
- World - Crude steel production was 1,622.8 million tons (Mt) in December 2015, a -2.8% decrease compared to December 2014 (YoY)
Crude steel production decreased in all regions except Oceania in 2015.
- Asia - Annual crude steel production for Asia was 1,113.8 Mt in 2015, a decrease of -2.3% YoY.
China - Crude steel production was 803.8 Mt, down by -2.3% YoY.
China’s share of world crude steel production increased from 49.3% in 2014 to 49.5% in 2015
Japan - 105.2 Mt in 2015, down by -5% YoY.
- EU - EU (28) produced 166.2 Mt of crude steel in 2015, a decrease of -1.8% YoY
Germany - Produced 42.7 Mt of crude steel in 2015, down by -0.6% YoY
Italy - Produced 22.0 Mt in 2015, a decrease of -7.1% YoY
France - Produced 15.0 Mt, down by -7.2% YoY
Spain - Produced 14.9 Mt of crude steel in 2015, an increase of 4.4% YoY
- Middle East
Turkey - Produced 31.5 Mt, down by -7.4% YoY
Iran - Produced 16.11 Mt, down by -1.4% YoY approx.
- CIS - Produced 101.5 Mt of crude steel, a decrease of -4.3% YoY
Russia - Produced 71.1 Mt of crude steel, down by -0.5% YoY
Ukraine - Produced 22.9 Mt, a decrease of -15.6% YoY
- Others
US - Produced 78.9 Mt of crude steel, down by -10.5% YoY
Brazil - Produced 33.2 Mt in 2015, down by -1.9% YoY
November
- World - Crude steel production was 127 million tons (Mt) in November 2015, a -4.1% decrease compared to November 2014 (YoY)
- Asia
China - Crude steel production was 63.3 Mt, a -1.6% decrease YoY.
Japan - Produced 8.7 Mt, down by -4.7% YoY.
- EU
Germany - Produced 3.5 Mt of crude steel, down by -3.1% YoY
Italy - Produced 1.9 Mt of crude steel, up by 0.4% YoY
France - Produced 1.2 Mt of crude steel, down by -14.7% YoY
Spain - Produced 1.2 Mt of crude steel, down by 2.9% YoY
- Middle East
Turkey - 2.6 Mt, down by -7.2% YoY
Iran - 1.28 Mt, down by -12.3% YoY approx.
- CIS
Russia - 5.7 Mt, down by -3.1% YoY
Ukraine - 1.9 Mt, up by 3.1% YoY
- Others
US - Produced 6.1 Mt of crude steel, down by -15.6% lower YoY
Brazil - Produced 2.5 Mt of crude steel, down by -4.4% YoY
October
- World - Crude steel production was 134 million tons (Mt) in October 2015, a -3.1% decrease compared to October 2014 (YoY)
- Asia
China - Crude steel production was 66.1 Mt, a -3.1% decrease YoY.
Japan - Produced 9.0 Mt, down by -3.8% YoY.
- EU
Germany - Produced 3.6 Mt of crude steel, up by 2.7% YoY
Italy - Produced 1.9 Mt of crude steel, down by 8.6% YoY
- Middle East
Turkey - 2.8 Mt, up by 2.0% YoY
Iran - 1.44 Mt, down by -4.43% YoY approx.
- CIS
Russia - 5.7 Mt, down by -2.4% YoY
Ukraine - 2.1 Mt, up by 6.4% YoY
- Others
US - Produced 6.7 Mt of crude steel, down by -8.8% lower YoY
Brazil - Produced 3.0 Mt of crude steel, down by -2.3% YoY
September
- World - Crude steel production was 131 million tons (Mt) in September 2015, a -3.7% decrease compared to September 2014 (YoY)
- Asia - In the first 9 months of 2015, Asia produced 828.9 Mt of crude steel, a decrease of -2.0% YoY
China - Crude steel production was 66.1 Mt, a -3.0% decrease YoY.
Japan - Produced 8.6 Mt, down by -7.3% YoY.
- EU - Produced 127.5 Mt of during the first 9 months, slightly down by -0.3% YoY
Germany - Produced 3.4 Mt of crude steel, down by -3.9% YoY
- Middle East
Turkey - 2.5 Mt, down by -14.1% YoY
Iran - 1.33 Mt, down by -6.44% YoY approx.
- CIS - Produced 75.9 Mt in the first 9 months, a decrease of -5.8% YoY.
Russia - 5.5 Mt, down by -3.2% YoY
Ukraine - 2.1 Mt, up by 14.1% YoY
- Others
US - Produced 6.7 Mt of crude steel, down by -8.5% lower YoY
Brazil - Produced 2.5 Mt of crude steel, down by -13% YoY
August
- World - Crude steel production was 132 million tons (Mt) in August 2015, a -3.0% decrease compared to August 2014 (YoY)
- Asia
China - Crude steel production was 66.9 Mt, a -3.5% decrease YoY.
Japan - Produced 8.8 Mt, down by -5.8% YoY.
- EU
Germany - Produced 3.4 Mt of crude steel, up by 10.7% YoY
- Middle East
Turkey - 2.65 Mt, down by -11.8% YoY
Iran - 1.25 Mt, down by -6.2% YoY approx.
- CIS
Russia - 6.0 Mt, down by -3.2% YoY
Ukraine - 1.9 Mt, up by 8.6% YoY
- Others
US - Produced 7.0 Mt of crude steel, down by -9.7% lower YoY
Brazil - Produced 2.8 Mt of crude steel, down by -5.4% YoY
July
- World - Crude steel production was 133 million tons (Mt) in July 2015, a -3.8% decrease compared to July 2014 (YoY)
- Asia
China - Crude steel production was 65.8 Mt, a -4.6% decrease YoY.
Japan - Produced 8.8 Mt, down by -4.9% YoY.
India - Produced 7.7 Mt, up by 1.2% YoY.
- EU
Germany - Produced 3.6 Mt of crude steel, up by 4.7% YoY
- Middle East
Turkey - 2.5 Mt, down by -10.4% YoY
Iran - 1.27 Mt, down by -1.3% YoY approx.
- CIS
Russia - 6.0 Mt, down by -2.8% YoY
Ukraine - 1.9 Mt, down by -24.1% YoY
- Others
US - Produced 7.0 Mt of crude steel, down by -9.1% lower YoY
Brazil - Produced 2.98 Mt of crude steel, down by -3.1% YoY
June
- World - Crude steel production reached 136 million tons (Mt) in
June 2015, an decrease of -2.4% over June 2014 (YoY). World crude steel production in the first six months of 2015 was 813.0 Mt, a decrease of -2.0% YoY
- Asia
China - Crude steel production was 69.0 Mt, a -0.8% decrease YoY.
Japan - Produced 8.6 Mt, down by -6.2% YoY.
India - Produced 7.4 Mt, up by 0.8% YoY.
- EU
Germany - Produced 3.8 Mt of crude steel, up by 5.8% YoY
Italy - Produced 1.9 Mt of crude steel, down by -11.4% YoY
- Middle East - showed an increase in production of 2.9%
Turkey - 2.8 Mt, down by -4.5% YoY
Iran - 1.42 Mt, up by 1.4% YoY approx.
- CIS
Russia - 5.6 Mt, down by -7.5% YoY
Ukraine - 2.0 Mt, down by -21.8% YoY
- Others
US - Produced 6.7 Mt of crude steel, down by -8.5% lower YoY
Brazil - Produced 2.8 Mt of crude steel, up by 2.1% YoY
May
- World - Crude steel production reached 139 million tons (Mt) in
May 2015, an decrease of -2.1% over May 2014 (YoY).
- Asia
China - Crude steel production was 70.0 Mt, a -1.7% decrease YoY.
Japan - Produced 8.9 Mt, down by -7.0% YoY.
- EU
Germany - Produced 3.7 Mt of crude steel, a decrease
of -5.4% YoY
Italy - Produced 2.0 Mt of crude steel, down by -12.6% YoY
- Middle East
Turkey - 2.9 Mt, down by -4.3% YoY
Iran - 1.275 Mt, down by -12.4% YoY approx.
- CIS
Russia - 6.1 Mt, down by -1.9% YoY
Ukraine - 2.2 Mt, down by -23.0% YoY
- Others
US - Produced 6.85 Mt of crude steel, down by -8.5% lower YoY
Brazil - Produced 3.0 Mt of crude steel, up by 3.8% YoY
April
- World - Crude steel production reached 135 million tons (Mt) in
April 2015, an decrease of -1.7% over April 2014 (YoY).
- Asia
China - Crude steel production was 68.9 Mt, a -0.7% decrease YoY.
Japan - Produced 8.4 Mt, down by -6.1% YoY.
- EU
Germany - Produced 3.6 Mt of crude steel, a decrease
of -1.9% YoY
Italy - Produced 1.9 Mt of crude steel, down by -8.5% YoY
- Middle East
Turkey - 2.8 Mt, up by 3.9% YoY
Iran - 1.275 Mt, down by -12.4% YoY approx.
- CIS
Russia - 6.1 Mt, up by 3.2% YoY
Ukraine - 1.9 Mt, down by -24.9% YoY
- Others
US - Produced 6.5 Mt of crude steel, down by -9.8% lower YoY
Brazil - Produced 2.9 Mt of crude steel, up by 4.4% YoY
March
- World - Crude steel production reached 138 million tons (Mt) in
March 2015, an decrease of -2.7% over March 2014 (YoY).
- Asia - Produced 272.0 Mt in Q1-2015, a decrease of -1.1% YoY
China - Crude steel production was 69.5 Mt, a -1.2% decrease YoY.
Japan - Produced 9.3 Mt, down by -4.5% YoY.
- EU - Produced 43.7 Mt in Q1-2015, slightly down by -0.6% YoY
Germany - Produced 3.9 Mt of crude steel, a decrease
of -4.4% YoY
Italy - Produced 2.1 Mt of crude steel, down by -9.8% YoY
- Middle East
Turkey - 2.8 Mt, down by -4.1% YoY
Iran - 1.314 Mt, sligltly up by 0.45% YoY
- CIS - Produced 24.8 Mt in Q1-2015, a decrease of -5.9% YoY.
- Others
US - Produced 6.6 Mt of crude steel, down by -12.7% lower YoY
Brazil - Produced 2.8 Mt of crude steel, down by -7.4% YoY
February
- World - Crude steel production reached 128 million tons (Mt) in
February 2015, an increase of 0.6% over February 2014 (YoY).
- Asia
China - Crude steel production was 65 Mt
Japan - Produced 8.4 Mt, down by -0.2% YoY.
S. Korea - Produced 5.1 Mt, down by -4.4% YoY.
- EU
Germany - Produced 3.5 Mt of crude steel, a decrease
of -1.6% YoY
Italy - Produced 2.0 Mt of crude steel, down by -9.7% YoY
- Middle East
Turkey - 2.4 Mt, down by -12.2% YoY
Iran - 1.4 Mt, up by nearly 12% YoY
- Others
Russia - Produced 5.7 Mt of crude steel, up by 5.6% YoY
Ukraine - Produced 1.6 Mt of crude steel, down by -33.2% YoY
US - Produced 6.34 Mt of crude steel, down by -7.9% lower YoY
January
- World - Crude steel production reached 133 million tons (Mt) in
January 2015, a decrease of -2.94% over January 2014 (YoY).
-
Asia
China - Crude steel production was 65.5 Mt, down by -4.7% YoY
Japan - Produced 9.0 Mt, down by -4.0% YoY.
- EU
Germany - Produced 3.7 Mt of crude steel, an increase
of 0.5% YoY
Italy - Produced 1.9 Mt of crude steel, down by -11.3% YoY
- Middle East
Turkey -
2.6 Mt, down by -10.4% YoY
Iran - 1.36 Mt, up by nearly 20% YoY
- Others
Russia - Produced 6.1 Mt of crude steel, up by 6.0% YoY
Ukraine - Produced 1.9 Mt of crude steel, down by -25.2% YoY
US - Produced 7.4 Mt of crude steel, up by 0.4% lower YoY
Crude Steel Production Statistics Archive:
2005,
2006,
2007,
2008,
2009,
2010,
2011,
2012,
2013,
2014, 2015
Other Middle East Production Statistics
Source: World Steel Association