In thousands of metric tons
|
Countries |
Jan |
Feb |
Mar |
Apr |
May |
Jun |
Jul |
Aug |
Sep |
Oct |
Nov |
Dec |
2019 |
2018 |
|
Egypt |
722 |
686 |
706 |
728 |
651 |
603 |
526 |
408 |
496 |
552 |
604 |
574 |
7,256 |
7,807 |
|
Iran |
1971 |
2017 |
2235 |
2800 |
2895 |
2800 |
2895 |
2895 |
2800 |
2895 |
2800 |
2895 |
31,898 |
24,520 |
|
Libya |
29 |
48 |
46 |
57 |
46 |
54 |
52 |
31 |
46 |
68 |
66 |
63 |
606 |
397 |
|
Morocco |
- |
- |
- |
- |
- |
- |
- |
- |
- |
- |
- |
|
0 |
0 |
|
Qatar |
221 |
175 |
235 |
192 |
235 |
231 |
230 |
229 |
222 |
228 |
174 |
186 |
2,558 |
2,575 |
|
Saudi Arabia |
469 |
448 |
397 |
405 |
439 |
464 |
456 |
463 |
412 |
331 |
399 |
410 |
5,093 |
5,241 |
|
Turkey |
2569 |
2635 |
2986 |
3044 |
3063 |
2698 |
2925 |
2634 |
2733 |
2687 |
2886 |
2893 |
33,753 |
37,310 |
|
UAE |
304 |
289 |
212 |
269 |
291 |
287 |
225 |
286 |
293 |
285 |
289 |
297 |
3,327 |
3,247 |
|
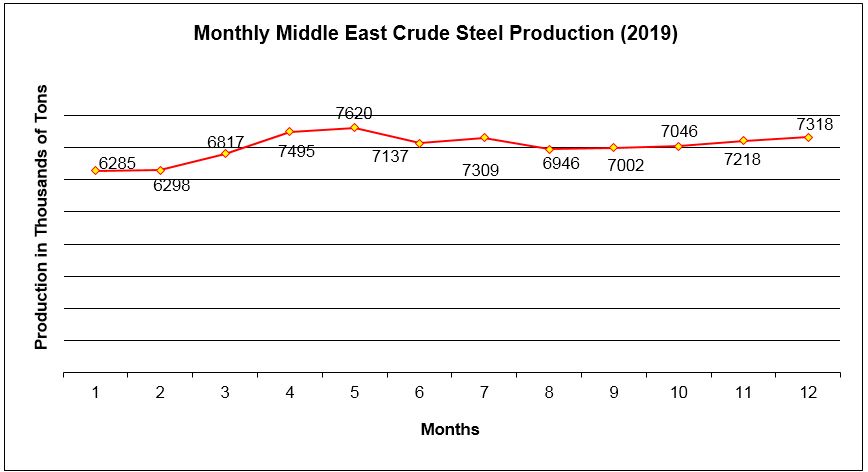
Total |
6285 |
6298 |
6817 |
7495 |
7620 |
7620 |
7137 |
7309 |
6946 |
7046 |
7218 |
7318 |
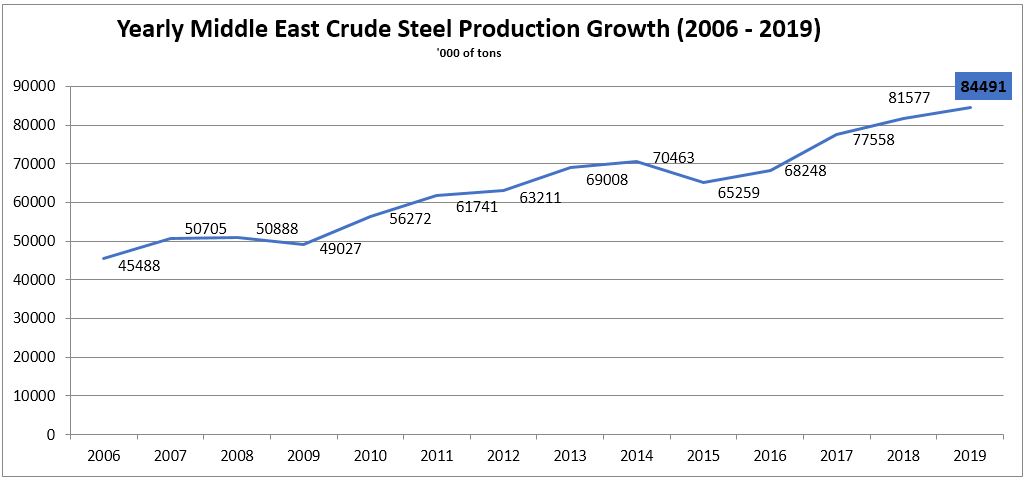
84,491 |
81,097 |
Monthly Middle East Steel Production Difference (December 2018 vs. December2019)
| Countries |
Dec-18 |
Nov-19 |
Dec-19 |
MoM % |
YoY % |
| Egypt |
670 |
604 |
574 |
-4.97 |
-14.33 |
| Iran |
2068 |
2800 |
2895 |
3.39 |
39.99 |
| Libya |
55 |
66 |
63 |
-4.55 |
14.55 |
| Morocco |
- |
- |
- |
- |
- |
| Qatar |
202 |
174 |
186 |
6.90 |
-7.92 |
| S. Arabia |
468 |
399 |
410 |
2.76 |
-12.39 |
| Turkey |
2886 |
2886 |
2893 |
0.24 |
0.24 |
| UAE |
2925 |
289 |
297 |
2.77 |
1.71 |
| Total |
6641 |
7218 |
7318 |
1.39 |
10.19 |
December
- World - Crude steel production reached 152.121 million tons (Mt) in
December 2019, up by 4% over December 2018 (YoY).
- Asia
China - Crude steel production was 84.265 Mt, up by 11.6% YoY.
India - Produced 9.28 Mt, down by 0.8 pct YoY
Japan - Produced 7.78 Mt, down by 8 pct YoY
South Korea - Produced 5.87 Mt, down by 4.7 pct YoY
- Middle East
Turkey - 2.89 Mt, up by 0.2% YoY
- EU
Italy - Produced 1.4 Mt, down by 17.2% YoY
Germany - Produced 2.85 Mt, down by 11.7% YoY
- US - Produced 7.45 Mt, down by 7.3% YoY
- Brazil - Produced 2.41 Mt, down by 10.8% YoY
- Ukraine - Produced 1.5 Mt, down by 17.2% YoY
November
- World - Crude steel production reached 147.8 million tons (Mt) in
November 2019, down by 1% over November 2018 (YoY).
- Asia
China - Crude steel production was 80.3 Mt, up by 4% YoY.
India - Produced 8.9 Mt, down by 2.8 pct YoY
Japan - Produced 7.7 Mt, down by 10.6 pct YoY
South Korea - Produced 5.9 Mt, down by 0.5 pct YoY
- Middle East
Turkey - 2.9 Mt, down by 8.1% YoY
- EU
Italy - Produced 2 Mt, down by 9.8% YoY
France - Produced 1.1 Mt, down by 18.2% YoY
Spain - Produced 1.1 Mt, down by 10.9% YoY
- US - Produced 7.2 Mt, down by 2.2% YoY
- Brazil - Produced 2.6 Mt, down by 10.5% YoY
- Ukraine - Produced 1.3 Mt, down by 20.1% YoY
October
- World - Crude steel production reached 151.5 million tons (Mt) in
October 2019, down by 2.8% over October 2018 (YoY).
- Asia
China - Crude steel production was 81.5 Mt, down by 0.6% YoY.
India - Produced 9.1 Mt, down by 3.4 pct YoY
Japan - Produced 8.2 Mt, down by 4.9 pct YoY
South Korea - Produced 6 Mt, down by 3.5 pct YoY
- Middle East
Turkey - 2.7 Mt, down by 1.5% YoY
- EU
Germany - Produced 3.3 Mt, down by 6% YoY
France - Produced 1.2 Mt, down by 10.6% YoY
Spain - Produced 1.2 Mt, down by 7.6% YoY
- US - Produced 7.4 Mt, down by 2% YoY
- Brazil - Produced 2.4 Mt, down by 22% YoY
- Ukraine - Produced 1.6 Mt, down by 12.7% YoY
September
- World - Crude steel production reached 151.5 million tons (Mt) in
September 2019, down by 0.3% over September 2018 (YoY).
- Asia
China - Crude steel production was 82.8 Mt, up by 2.2% YoY.
India - Produced 9 Mt, up by 1.6 pct YoY
Japan - Produced 8 Mt, down by 4.5 pct YoY
South Korea - Produced 5.7 Mt, down by 2.7 pct YoY
- Middle East
Turkey - 2.7 Mt, down by 6.9% YoY
- EU
Germany - Produced 3.4 Mt, down by 4% YoY
France - Produced 1.2 Mt, down by 10.2% YoY
Spain - Produced 1.2 Mt, down by 1% YoY
- US - Produced 7.1 Mt, down by 2.5% YoY
- Brazil - Produced 2.4 Mt, down by 22% YoY
- Ukraine - Produced 1.7 Mt, down by 2.3% YoY
August
- World - Crude steel production reached 156 million tons (Mt) in
August 2019, up by 3.4% over August 2018 (YoY).
- Asia
China - Crude steel production was 87.3 Mt, up by 9.3% YoY.
Japan - Produced 8.1 Mt, down by 7.8 pct YoY
South Korea - Produced 5.9 Mt, down by 2.6 pct YoY
- Middle East
Turkey - 2.6 Mt, down by 12.4% YoY
- US - Produced 7.5 Mt, up by 0.3% YoY
- Brazil - Produced 2.5 Mt, down by 13.4% YoY
- Ukraine - Produced 1.9 Mt, up by 8.5% YoY
July
- World - Crude steel production reached 156.7 million tons (Mt) in
July 2019, up by 1.7% over June 2018 (YoY).
- Asia
China - Crude steel production was 85.2 Mt, up by 5% YoY.
India - Produced 9.2 Mt, up by 1.7% YoY
Japan - Produced 8.4 Mt, down by 0.4 pct YoY
- Middle East
Turkey - 2.9 Mt, down by 10.6% YoY
- US - Produced 7.5 Mt, up by 1.8% YoY
- Brazil - Produced 2.4 Mt, down by 20.7% YoY
- EU
Germany - Produced 3.3 Mt, up by 0.8% YoY
France - Produced 1.1 Mt, up by 11.2% YoY
Spain - Produced 1.1 Mt, down by 4.6% YoY
- Ukraine - Produced 1.8 Mt, down by 1.7% YoY
June
- World - Crude steel production reached 159 million tons (Mt) in
June 2019, up by 4.6% over June 2018 (YoY).
- Asia
China - Crude steel production was 87.5 Mt, up by 10% YoY.
India - Produced 9.3 Mt, up by 4% YoY
Japan - Produced 8.8 Mt, down by 0.4 pct YoY
- Middle East
Turkey - 2.7 Mt, down by 11% YoY
- US - Produced 7.3 Mt, up by 3.1% YoY
- Brazil - Produced 2.8 Mt, down by 3.1% YoY
- EU
Italy - Produced 2.1 Mt, down by 2.5% YoY
France - Produced 1.3 Mt, up by 3.4% YoY
Spain - Produced 1.2 Mt, up by 2.3% YoY
- Ukraine - Produced 1.7 Mt, down by 3% YoY
May
- World - Crude steel production reached 162.7 million tons (Mt) in
May 2019, up by 5.4% over May 2018 (YoY).
- Asia
China - Crude steel production was 89.1 Mt, up by 10% YoY.
India - Produced 9.2 Mt, up by 5.1% YoY
Japan - Produced 8.7 Mt, down by 4.6 pct YoY
- Middle East
Turkey - 3.1 Mt, down by 8% YoY
- US - Produced 7.7 Mt, up by 5.4% YoY
- Brazil - Produced 2.8 Mt, up by 2.9% YoY
- EU
Italy - Produced 2.2 Mt, up by 1.1% YoY
France - Produced 1.2 Mt, down by 7.6% YoY
Spain - Produced 1.3 Mt, down by 7.1% YoY
- Ukraine - Produced 1.8 Mt, up by 7.8% YoY
April
- World - Crude steel production reached 156.7 million tons (Mt) in
April 2019, up by 6.4% over April 2018 (YoY).
- Asia
China - Crude steel production was 85 Mt, up by 12.7% YoY.
India - Produced 8.8 Mt, up by 1.5% YoY
Japan - Produced 8.6 Mt, down by 0.8 pct YoY
- Middle East
Turkey - 3 Mt, up by 2.6% YoY
- US - Produced 7.4 Mt, up by 7.3% YoY
- Brazil - Produced 2.9 Mt, down by 1.9% YoY
- EU
Italy - Produced 2 Mt, down by 5.7% YoY
France - Produced 1.3 Mt, down by 8.1% YoY
Spain - Produced 1.3 Mt, down by 4.4% YoY
- Ukraine - Produced 1.9 Mt, up by 12.6% YoY
March
- World - Crude steel production reached 155 million tons (Mt) in
March 2019, up by 4.9% over March 2018 (YoY).
- Asia
China - Crude steel production was 80.3 Mt, up by 10% YoY.
India - Produced 9.4 Mt, down by 1% YoY
Japan - Produced 9.1 Mt, unchanged YoY
- Middle East
Turkey - 3 Mt, down by 11.7% YoY
- US - Produced 7.8 Mt, up by 5.7% YoY
- Brazil - Produced 2.8 Mt, down by 8.6% YoY
- EU
Italy - Produced 2.3 Mt, down by 0.3% YoY
France - Produced 1.4 Mt, up by 2.3% YoY
Spain - Produced 1.4 Mt, up by 5.9% YoY
- Ukraine - Produced 2 Mt, up by 15% YoY
February
- World - Crude steel production reached 137.3 million tons (Mt) in
February 2019, up by 4.1% over February 2018 (YoY).
- Asia
China - Crude steel production was 71 Mt, up by 9.2% YoY.
India - Produced 8.7 Mt, up by 2.3% YoY
Japan - Produced 7.7 Mt, down by 6.6% YoY
- Middle East
Turkey - 2.6 Mt, down by 12.5% YoY
- US - Produced 6.9 Mt, up by 4.6% YoY
- Brazil - Produced 2.7 Mt, down by 1.7% YoY
- EU
Italy - Produced 2 Mt, down by 2.7% YoY
France - Produced 1.2 Mt, down by 0.3% YoY
Spain - Produced 1.1 Mt, up by 2.5% YoY
- Ukraine - Produced 1.7 Mt, up by 5% YoY
January
- World - Crude steel production reached 146.7 million tons (Mt) in
January 2019, up by 1% over January 2018 (YoY).
- Asia
China - Crude steel production was 75 Mt, up by 4.3% YoY.
India - Produced 9.2 Mt, down by 1.9% YoY
Japan - Produced 8.1 Mt, down by 9.8% YoY
- Middle East
Turkey - 2.6 Mt, down by 19.5% YoY
- US - Produced 7.6 Mt, up by 11% YoY
- Brazil - Produced 2.9 Mt, up by 2.3% YoY
- EU
Italy - Produced 2 Mt, down by 3.6% YoY
France - Produced 1.2 Mt, down by 9.7% YoY
Spain - Produced 1.2 Mt, up by 5.9% YoY
- Ukraine - Produced 1.9 Mt, down by 4.9% YoY
Crude Steel Production Statistics Archive:
2005,
2006,
2007,
2008,
2009,
2010,
2011,
2012,
2013,
2014,
2015,
2016,
2017,
2018,
2019,
Other Middle East Production Statistics
Source: World Steel Association