In thousands of metric tons
|
Countries |
Jan |
Feb |
Mar |
Apr |
May |
Jun |
Jul |
Aug |
Sep |
Oct |
Nov |
Dec |
Total |
|
Algeria |
19 |
21 |
62 |
49 |
60 |
50 |
20 |
28 |
30 |
35 |
30 |
35
|
439 |
|
Egypt |
677 |
511 |
520 |
524 |
557 |
525 |
516 |
523 |
592 |
615 |
632 |
562 |
6.754 |
|
Iran |
1.111 |
1.199 |
1.215 |
1.264 |
1.287 |
1.284 |
1.302 |
1.292 |
1.364 |
1.378
|
1.375 |
1.350
|
15.421 |
|
Libya* |
41 |
65 |
75 |
72 |
73 |
64 |
43 |
40 |
42 |
61
|
70
|
70
|
716 |
|
Morocco |
53 |
26 |
55 |
50 |
52 |
48 |
43 |
31 |
49 |
51
|
43
|
27
|
558 |
|
Qatar* |
197 |
179 |
201 |
188 |
192 |
191 |
195 |
196 |
186 |
187
|
162
|
162
|
2.236 |
|
Saudi Arabia |
463 |
437 |
468 |
457 |
479 |
454 |
464 |
454 |
352 |
467
|
389
|
461
|
5.354 |
|
Turkey |
2.854 |
2.647 |
2.972 |
2.883 |
3.037 |
2.927 |
2.794 |
2.547 |
2.987 |
3.050 |
3.057 |
2.899
|
34.654 |
|
UAE* |
216 |
230 |
251 |
181 |
271 |
247 |
245 |
254 |
247 |
245
|
249
|
240
|
2.876 |
|
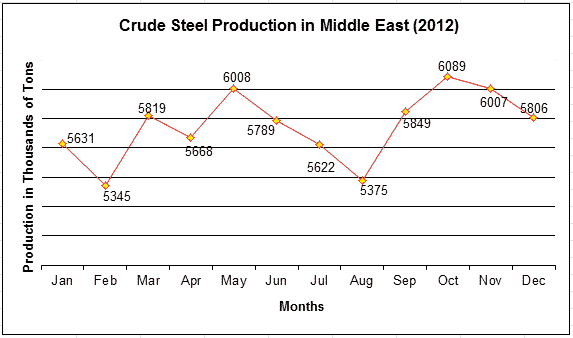
Total |
5.631 |
5.345 |
5.819 |
5.668 |
6.008 |
5.789 |
5.622 |
5.375 |
5.849 |
6.089 |
6.007 |
5.506 |
69.008 |
Annual Middle East crude steel production (2012 to 2013)
| Countries |
2012 |
2013 |
% Change |
| Algeria |
506 |
439 |
-13.24 |
| Egypt |
6.627 |
6.754 |
1.92 |
| Iran |
14.463 |
15.421 |
6.62 |
| Libya* |
0 |
716 |
- |
| Morocco |
529 |
558 |
5.48 |
| Qatar* |
0 |
2.236 |
- |
| S. Arabia |
5.202 |
5.354 |
2.92 |
| Turkey |
35.884 |
34.654 |
-3.43 |
| UAE* |
0 |
2.876 |
- |
| Total |
63.211 |
69.008 |
9.17 |
*Qatar, Libya, UAE didn't report 2012 statistics
December
- World - Crude steel production reached 1,607 megatonnes (Mt) for the year 2013, up by 3.5% compared to 2012 (YoY).
The growth came mainly from Asia and Middle East while in all other regions it decreased in 2013 compared to 2012.
- Asia - Annual production for Asia was 1,080.9Mt of crude steel in 2013, an increase of 6.0% compared to 2012.
The region's share of world steel production increased slightly from 65.7% in 2012 to 67.3% in 2013
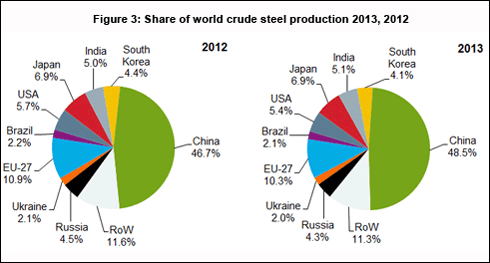
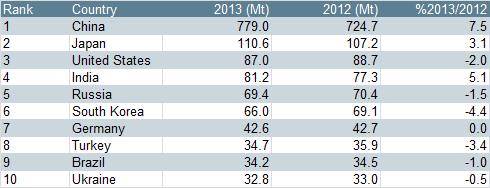
China - Crude steel production in 2013 reached 779.0 Mt, an increase of 7.5% on 2012.
China's share of world crude steel production increased from 46.7% in 2012 to 48.5% in 2013
Japan - Produced 110.6 Mt in 2013, a 3.1% increase from 2012.
S. Korea - Crude steel production was 66.0 Mt, a decrease of -4.4% compared to 2012.
- EU - Recorded a decrease of -1.8% compared to 2012, producing 165.6 Mt of crude steel in 2013
Germany - Produced 42.6 Mt of crude steel in 2013, remaining at the same production level as 2012
Italy - Produced 24.1 Mt in 2013, a -11.7% decrease over 2012
Spain - Crude steel production was 13.7 Mt of crude steel in 2013, a 0.7% increase on 2012
France - Produced 15.7 Mt, an increase of 0.5% YoY
- Middle East - Produced 26.3 MT steel, up by 6.8 per cent, over 24.7 MT production a year ago.
Turkey - 2.9 Mt, up by 1.9% YoY
Iran - 1.35 Mt, up by nearly 13.6% YoY. Iran produced 15.42 million tons of crude steel last year, showing a 6.6-percent rise compared with the figure for 2012, which was 14.46 million tons.
- CIS - Showed a decrease of -1.8% in 2013, producing 108.9 Mt of crude steel
Russia - Produced 69.4 Mt of crude steel, a decrease of -1.5% on 2012.
Ukraine - Recorded a decrease of -0.5% with a year-end figure of 32.8 Mt YoY.
- Others
US - Produced 87.0 Mt of crude steel, down by -2.0% YoY
Brazil - Produced 34.2 Mt in 2013, down by -1.0% compared to 2012
November
- World - Crude steel production reached 127 million tonnes (Mt) in
November 2013, an increase of 3.6% compared to November 2012 (YoY).
- Asia
China - Crude steel production was
60.9 Mt, an
increase of 4.2% YoY.
Japan - Produced 9.3 Mt, up by 8.9% YoY.
S. Korea - Crude steel production was 5.6 Mt, down by -0.2% YoY
- EU
Germany - Produced 3.7 Mt of crude steel, up by 5.7% YoY
Italy - Produced 2.1 Mt of crude steel, a decrease
of -4.5.1% YoY
Spain - Crude steel production was 1.2 Mt, up by 15.5% YoY
France - Produced 1.3 Mt, up by 3.5% YoY
- Middle East
Turkey - 3.1 Mt, up by 3 % YoY
Iran - 1.375 Mt, up by 12.5% YoY
- CIS
Russia produced 5.5 Mt of crude steel, a decrease of -0.7% YoY
Ukraine produced 2.5 Mt, down by -7.9% YoY
- Others
US - Produced 7.1 Mt of crude steel, up by 5.3% YoY
October
- World - Crude steel production reached 134 million tonnes (Mt) in
October 2013, an increase of 6.6% compared to October 2012 (YoY).
- Asia
China - Crude steel production was
65.1 Mt, an
increase of 9.2% YoY.
Japan - Produced 9.5 Mt, up by 7.7% YoY.
S. Korea - Crude steel production was 5.9 Mt, up by 5.2% YoY
- EU
Germany - Produced 3.8 Mt of crude steel, up by 1.9% YoY
Italy - Produced 2.2 Mt of crude steel, a decrease
of -10.1% YoY
Spain - Crude steel production was 1.4 Mt, up by 23.9% YoY
France - Produced 1.3 Mt, down by -1.8% YoY
- Middle East
Turkey - 3.1 Mt, up by 6.9% YoY
Iran - 1.37 Mt, up by 18.2% YoY
- CIS
Russia produced 5.7 Mt of crude steel, a decrease of -1.5% YoY
Ukraine produced 2.6 Mt, an increase of 1.2% YoY
- Others
US - Produced 7.4 Mt of crude steel, up by 8.7% YoY
September
- World - Crude steel production reached 133 million tonnes (Mt) in
September 2013, an increase of 6.1% compared to September 2012 (YoY).
World crude steel production was 1,186 Mt in the first 9-months of 2013, an
increase of 2.7% compared to the same months of 2012
-
Asia - Produced 795.1 Mt of crude steel in the first three quarters
of 2013, an increase of 5.9% YoY.
China - Crude steel production was
65.4 Mt, an
increase of 11% YoY.
Japan - Produced 9.3 Mt, up by 5.5% YoY.
S. Korea - Crude steel production was 5.2 Mt, a -8.7% decrease YoY
- EU -
produced 123.8 Mt of crude steel in the first nine months of 2013, down
by -4.2% YoY
Germany - Produced 3.6 Mt of crude steel, up by 1.4% YoY
Italy - Produced 2.1 Mt of crude steel, a decrease
of -10.4% YoY
Spain - Crude steel production was 1.3 Mt, up by 5.9% YoY
France - Produced 1.4 Mt, up by 7.4% YoY
- Middle East
Turkey -
3 Mt, down by -1.2% YoY
Iran -
1.36 Mt, up by 10.75% YoY
- CIS - Produced 81.5 Mt of crude steel in the first nine months of
2013, down by -3.4% YoY
- Others
US - Produced 7.2 Mt of crude steel, up by 6.3% YoY
August
- World - Crude steel production reached 130 million tonnes (Mt) in
August 2013, an increase of 5.2% compared to August 2012 (YoY).
-
Asia
China - Crude steel production was 66.3 Mt, an
increase of 12.8% YoY.
Japan - Produced 9.1 Mt, down by -0.6% YoY.
S. Korea - Crude steel production was 4.9 Mt, a -13.1% decrease YoY
- EU
Germany - Produced 3.2 Mt of crude steel, a decrease
of -6.3% YoY
Italy - Produced 1.1 Mt of crude steel, a decrease
of -7.5% YoY
Spain - Crude steel production was 1 Mt, up by 10.3% YoY
France - Produced 1.2 Mt, up by 21.7% YoY
- Middle East
Turkey -
2.6 Mt, down by -15.4% YoY
Iran -
1.29 Mt, up by 13.2% YoY
- CIS
Russia - Produced 5.8 Mt, down by -1.9% YoY
Ukraine - Produced 2.8 Mt, up by 4.1% YoY
- Others
US - Produced 7.4 Mt of crude steel, down by -2.9% YoY
July
- World - Crude steel production reached 132 million tonnes (Mt) in
July 2013, an increase of 2.7% compared to July 2012 (YoY).
-
Asia
China - Crude steel production was 65.5 Mt, an
increase of 6.2% YoY.
Japan - Produced 9.3 Mt, up by 0.5% YoY.
S. Korea - Crude steel production was 5.6 Mt, a -5.8% decrease YoY
- EU
Germany - Produced 3.4 Mt of crude steel, a decrease
of -5.4% YoY
Spain - Crude steel production was 1 Mt, a decrease of
-3.4% YoY
France - Produced 1.3 Mt, down by -9% YoY
- Middle East
Turkey -
2.8 Mt, down by -10.1% YoY
Iran -
1.3 Mt, up by 16.1% YoY
- CIS
Russia - Produced 5.7 Mt, down by -2.4% YoY
Ukraine - Produced 2.8 Mt, up by 8.8% YoY
- Others
US - Produced 7.6 Mt of crude steel, up by 3.3% YoY
June
- World - Crude steel production reached 132 million tonnes (Mt) in
June 2013, an increase of 1.9% compared to June 2012 (YoY).
In the first six months of 2013, it was 789.8 Mt, an increase of 2.0% YoY
-
Asia - In H1 of 2013, Asia showed an increase of 5.5% while other
regions recorded negative growth in the first half of 2013
China - Crude steel production was 64.7 Mt, an
increase of 4.6% YoY.
Japan - Produced 9.3 Mt, up by 0.9% YoY.
S. Korea - Crude steel production was 5.5 Mt, a -5.4% decrease YoY
- EU -
The EU 27 produced -5.1% less
Germany - Produced 3.7 Mt of crude steel, a decrease
of -2.2% YoY
Italy - Crude steel production was 2.2 Mt, a decrease of
-10.3% YoY
France - Produced 1.4 Mt, up by 2.8% YoY
- Middle East
Turkey -
3 Mt, up by 0.5% YoY
- CIS - The C.I.S. region showed a decrease of -3.0%
Russia - Produced 5.7 Mt, down by -0.8% YoY
Ukraine - Produced 3.1 Mt, up by 7.8% YoY
- Others
US - Produced 7.2 Mt of crude steel, -0.2% lower YoY
Brazil - Produced 2.8 Mt, up by 2.7% YoY
May
- World - Crude steel production reached 136 million tonnes (Mt) in
May 2013, an increase of 2.6% compared to May 2012.
-
Asia
China - Crude steel production was 67 Mt, an
increase of 7.3% YoY.
Japan - Produced 9.6 Mt, up by 4.3% YoY.
S. Korea - Crude steel production was 5.5 Mt, a -7.1% decrease YoY
- EU
Germany - Produced 3.7 Mt of crude steel, a decrease
of -1.5% YoY
Italy - Crude steel production was 2.3 Mt, a decrease of
-11.1% YoY
Spain - Produced 1.4 Mt, up by 4.3% YoY
France - Produced 1.4 Mt, down by -3.5% YoY
- Middle East
Turkey -
3 Mt, down by -2% YoY
- CIS
Russia - Produced 6.1 Mt, up by 0.2% YoY
Ukraine - Produced 2.8 Mt, down by -6.5% YoY
- Others
US - Produced 7.5 Mt of crude steel, -4.9% lower YoY
Brazil - Produced 3.0 Mt, up by 5.5% YoY
April
- World - Crude steel production reached 132 million tonnes (Mt) in
April 2013, an increase of 1.2% compared to April 2012.
-
Asia
China - Crude steel production was 65.7 Mt, an
increase of 6.8% YoY.
Japan - Produced 9.2 Mt, up by 1.0% YoY.
S. Korea - Crude steel production was 5.5 Mt, a -6.3% decrease YoY
- EU
Germany - Produced 3.7 Mt of crude steel, a decrease
of -0.9% YoY
Italy - Crude steel production was 2.1 Mt, a decrease of
-11.6% YoY
Spain - Produced 1.4 Mt, up by 10.3% YoY
France - Produced 1.2 Mt, down by -12.3% YoY
- Middle East
Turkey -
2.9 Mt, down by -0.7% YoY
- CIS
Russia - Produced 5.6 Mt, a decrease of -4.3% YoY
Ukraine - Produced 2.7 Mt, down by -8.4% YoY
- Others
US - Produced 7.3 Mt of crude steel, -7.3% lower YoY
Brazil - Produced 3.0 Mt, a decrease of -1.6% YoY
March
- World - Crude steel production reached 135 million tonnes (Mt) in
March 2013, an increase of 1.0% compared to March 2012.
- In the first three months of 2013, Asia produced 259.8 Mt of crude
steel, an increase of 6.4% over the first quarter of 2012.
The EU produced 41.5 Mt of crude steel in the first quarter of 2013, down by
-5.4% compared to the same quarter of 2012.
N. America’s production in the first three months was 29.7 Mt, a decrease of
-5.7% compared to the first quarter of 2012.
-
Asia
China - Crude steel production was 66.3 Mt, an
increase of 6.6% YoY.
Japan - Produced 9.4 Mt, up by 1.3% YoY.
S. Korea - Crude steel production was 5.7 Mt, a -7% decrease YoY
- EU
Germany - Produced 3.8 Mt of crude steel, a decrease
of -2.2% YoY
France - Produced 1.3 Mt of crude steel, a decrease of
-9.6% YoY
- Middle East
Turkey -
3 Mt, down by -4.6% YoY
- Others
US - Produced 7.3 Mt of crude steel, -8.4% lower YoY
February
- World - Crude steel production reached 123 million tons (Mt) in
February 2013, a 1.2% increase over February 2012.
-
Asia
China - Crude steel production was 61.8 Mt, an
increase of 9.8% YoY.
Japan - Produced 8.3 Mt, down by -3.4% YoY.
S. Korea - Crude steel production was 5 Mt, a -8.5% decrease YoY
- EU
Germany - Produced 3.4 Mt of crude steel, a decrease
of -3.7% YoY
Italy - Produced 2.1 Mt of crude steel, a decrease of
-15% YoY
France - Produced 1.3 Mt of crude steel, a decrease of
-0.8% YoY
- Middle East
Turkey -
2.7 Mt, down by -3.9% YoY
- Others
US - Produced 6.7 Mt of crude steel, -11.8% lower YoY
January
- World - Crude steel production reached 125 million tons (Mt) in
January 2013, a 0.8% increase over January 2012.
-
Asia
China - Crude steel production was 59.3 Mt, an
increase of 4.6% YoY.
Japan - Produced 8.9 Mt, a 2.7% increase YoY.
S. Korea - Crude steel production was 5.8 Mt, a -0.4% decrease YoY
- EU
Germany - Produced 3.6 Mt of crude steel, an increase
of 5.4% YoY
Italy - Produced 1.8 Mt of crude steel, a decrease of
-19.7% YoY
France - Produced 1.4 Mt of crude steel, a decrease of
-1.3% YoY
- Middle East
Turkey -
2.9 Mt, down by -2.5% YoY
- Others
Russia - Produced 5.7 Mt of crude steel, -5.7% lower YoY
Ukraine - Produced 2.7 Mt of crude steel, a -4.4% decrease YoY
US - Produced 7.3 Mt of crude steel, -5.8% lower YoY
Crude Steel Production Statistics Archive:
2005,
2006,
2007,
2008,
2009,
2010,
2011,
2012, 2013
Other Middle East Production Statistics
Source: World Steel Association