In thousands of metric tons
|
Countries |
Jan |
Feb |
Mar |
Apr |
May |
Jun |
Jul |
Aug |
Sep |
Oct |
Nov |
Dec |
2017 |
2016 |
% Change |
|
Egypt |
573 |
541 |
528 |
543 |
575 |
571 |
539 |
573 |
571 |
590 |
586 |
605 |
6795 |
5037 |
34.9 |
|
Iran |
1573 |
1426 |
1635 |
1735 |
1790 |
1785 |
1575 |
2306 |
1918 |
1980 |
1952 |
1980 |
21,725 |
17,893 |
21.42 |
|
Libya |
9 |
41 |
49 |
54 |
39 |
17 |
17 |
29 |
25 |
37 |
51 |
52 |
420 |
491 |
-14.46 |
|
Morocco |
50 |
45 |
50 |
45 |
45 |
45 |
45 |
45 |
- |
- |
- |
- |
370 |
520 |
-28.85 |
|
Qatar |
247 |
223 |
240 |
186 |
195 |
207 |
234 |
233 |
234 |
239 |
190 |
216 |
2644 |
2521 |
4.88 |
|
Saudi Arabia |
483 |
480 |
376 |
454 |
324 |
401 |
361 |
485 |
456 |
396 |
269 |
285 |
4770 |
5461 |
-12.65 |
|
Turkey |
2950 |
2759 |
3131 |
3046 |
3308 |
3021 |
3345 |
3182 |
3001 |
3306 |
3208 |
3268 |
37,525 |
33,163 |
13.15 |
|
UAE |
318 |
274 |
282 |
299 |
288 |
268 |
209 |
275 |
239 |
284 |
287 |
286 |
3309 |
3149 |
5.08 |
|
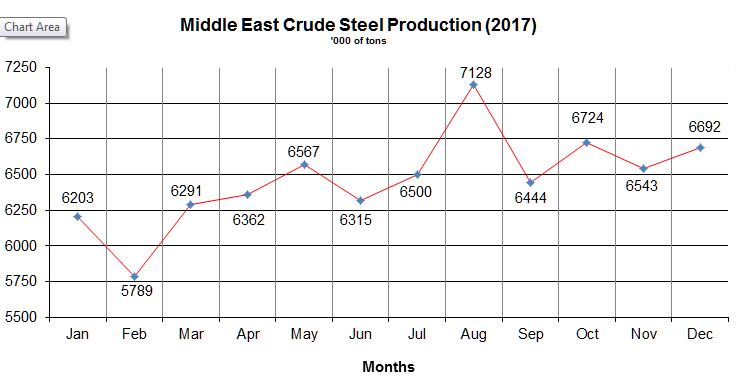
Total |
6203 |
5789 |
6291 |
6362 |
6567 |
6315 |
6500 |
7128 |
6444 |
6724 |
6543 |
6692 |
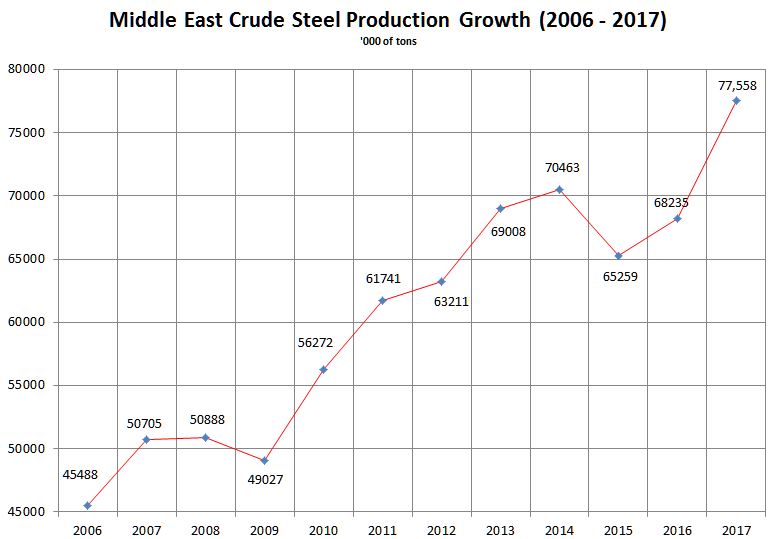
77,558 |
68,235 |
13.66 |
Monthly Middle East Steel Production Difference (Dec. 2016 vs. Dec. 2017)
| Countries |
Dec-16 |
Nov-17 |
Dec-17 |
MoM % |
YoY % |
| Egypt |
536 |
586 |
605 |
3.24 |
12.87 |
| Iran |
1521 |
1952 |
1980 |
1.43 |
30.18 |
| Libya |
50 |
51 |
52 |
1.96 |
4.00 |
| Morocco |
50 |
- |
- |
|
|
| Qatar |
216 |
190 |
216 |
13.68 |
0.00 |
| S. Arabia |
445 |
269 |
285 |
5.95 |
-35.96 |
| Turkey |
2838 |
3208 |
3268 |
1.87 |
15.15 |
| UAE |
325 |
287 |
286 |
-0.35 |
-12.00 |
| Total |
5981 |
6543 |
6692 |
2.28 |
11.89 |
Yearly Middle East Steel Production Difference (2016 vs. 2017)
| Countries |
2016 |
2017 |
% Change |
| Egypt |
5037 |
6795 |
34.90 |
| Iran |
17893 |
21725 |
21.42 |
| Libya |
491 |
420 |
-14.46 |
| Morocco |
520 |
370 |
-28.85 |
| Qatar |
2521 |
2644 |
4.88 |
| S. Arabia |
5461 |
4770 |
-12.65 |
| Turkey |
33,163 |
37,525 |
13.15 |
| UAE |
3149 |
3309 |
5.08 |
| Total |
68,235 |
77,558 |
13.66 |
December
- World - Crude steel production reached 1,691.2 million tonnes (Mt) for the year 2017, up by 5.3% compared to 2016 (YoY).
- Asia - Production was 1,162.5 Mt of crude steel in 2017, an increase of 5.4% YoY
China - Crude steel production was 831.7 Mt, up by 5.7% YoY. China’s share of world crude steel production increased from 49.0% in 2016 to 49.2% in 2017
Japan - Produced 104.7 Mt in 2017, down by -0.1% YoY
India - Produced 101.4 Mt, up by 6.2% YoY
- EU - EU (28) produced 168.7 Mt of crude steel, an increase of 4.1% YoY
Italy - Produced 24.0 Mt in 2017, up by 2.9% YoY
Spain - Produced 14.5 Mt, an increase of 6.2% YoY
- Middle East
Turkey - 37.5 Mt, up by 13.15% YoY
Iran - 21.7 Mt, up by 21.42% YoY
- US - Produced 81.6 Mt, up by 4.0% YoY
- Brazil - Produced 3.0 Mt, up by 15.3% YoY
November
- World - Crude steel production reached 136.3 million tons (Mt) in
November 2017, up by 2.2% over November 2016 (YoY).
- Asia
China - Crude steel production was 66.2 Mt, up by 2.2% YoY.
Japan - Produced 8.7 Mt, up by 1.0% YoY
- EU
Italy - Produced 2.2 Mt, up by 3.3% YoY
France - Produced 1.2 Mt, down by -8.7% YoY
- Middle East
Turkey - 3.1 Mt, up by 7.0% YoY
Iran - 1.95 Mt, up by 24.33% YoY
- US - Produced 6.7 Mt, up by 8.5% YoY
- Brazil - Produced 3.0 Mt, up by 15.3% YoY
October
- World - Crude steel production reached 145.3 million tons (Mt) in
October 2017, up by 5.9% over October 2016 (YoY).
- Asia
China - Crude steel production was 72.4 Mt, up by 6.1% YoY.
India - Produced 8.6 Mt, up by 5.3% YoY
Japan - Produced 9.0 Mt, down by -1.0% YoY
- EU
Italy - Produced 2.3 Mt, up by 6.1% YoY
France - Produced 1.4 Mt, up by 1.6% YoY
- Middle East
Turkey - 3.3 Mt, up by 11.1% YoY
Iran - 1.98 Mt, up by 24.22% YoY
- US - Produced 7.0 Mt, up by 12.0% YoY
- Brazil - Produced 3.0 Mt, up by 3.9% YoY
September
- World - Crude steel production reached 141.4 million tons (Mt) in
September 2017, up by 5.6% over September 2016 (YoY).
World crude steel production was 1,266.9 Mt in the first nine months of 2017, up by 5.6% YoY
- Asia - Asia produced 876.3 Mt of crude steel, an increase of 5.9% over the first nine months of 2016
China - Crude steel production was 71.8 Mt, up by 5.3% YoY.
Japan - Produced 8.6 Mt, up by 2.0% YoY
- CIS - The C.I.S. produced 76.4 Mt of crude steel in the first nine months of 2017, no change YoY.
- EU - The EU produced 126.4 Mt of crude steel in the first nine months of 2017, up by 4.1% YoY.
France - Produced 1.3 Mt, up by 3.2% YoY
Italy - Produced 2.2 Mt, up by 8.3% YoY
- Middle East
Turkey - 3.3 Mt, up by 13% YoY
Iran - 2.23 Mt, up by 40.43% YoY
- US - Produced 6.7 Mt, up by 8.6% YoY
- Brazil - Produced 3.0 Mt, up by 7.6% YoY
August
- World - Crude steel production reached 143.6 million tons (Mt) in
August 2017, up by 6.3% over August 2016 (YoY)
- Asia
China - Crude steel production was 74.6 Mt, up by 8.7% YoY.
Japan - Produced 8.7 Mt, down by -2.0% YoY
- EU
Germany - Produced 3.6 Mt, up by 3.3% YoY
- Middle East
Turkey - 3.2 Mt, up by 13.3% YoY
Iran - 1.75 Mt, up by almost 15.3% YoY
- US - Produced 7.1 Mt, up by 6.3% YoY
- Brazil - Produced 3.0 Mt, up by 1.2% YoY
July
- World - Crude steel production reached 143.2 million tons (Mt) in
July 2017, up by 6.3% over July 2016 (YoY)
- Asia
China - Crude steel production was 74.0 Mt, up by 10.3% YoY.
Japan - Produced 8.6 Mt, down by -4.3% YoY
- EU
Germany - Produced 3.5 Mt, up by 3.6% YoY
- Middle East
Turkey - 3.3 Mt, up by 27.8% YoY
Iran - 1.6 Mt, up by almost 16.6% YoY
- US - Produced 7.1 Mt, up by 5.6% YoY
- Brazil - Produced 2.8 Mt, up by 1% YoY
June
- World - Crude steel production reached 141 million tons (Mt) in
June 2017, up by 3.2% over June 2016 (YoY)
World crude steel production was 836.0 Mt in the H1-2017, up by 4.5% YoY
- Asia.- produced 576.8 Mt of crude steel in H1-2017, an increase of 4.8% YoY
China - Crude steel production was 73.2 Mt, up by 5.7% YoY.
Japan - Produced 8.4 Mt, down by -4.3% YoY
- EU - produced 86.1 Mt of crude steel in H1-2017, up by 4.1% YoY
Germany - Produced 3.6 Mt, down by -1.7% YoY
Italy - Produced 2.1 Mt, up by 1.8% YoY
- Middle East
Turkey - 3 Mt, up by 7.1% YoY
Iran - 1.8 Mt, up by almost 16% YoY
- US - Produced 6.7 Mt, down by -1.7% YoY
- Brazil - Produced 2.9 Mt, up by 13.2% YoY
- CIS - produced 49.7 Mt of crude steel in H1-2017, a decrease of -2.5% YoY
May
- World - Crude steel production reached 143.3 million tons (Mt) in
May 2017, up by 2.0% over May 2016 (YoY)
- Asia.
China - Crude steel production was 72.3 Mt, up by 1.8% YoY.
Japan - Produced 9.0 Mt, up by 0.1% YoY
- EU
Germany - Produced 3.8 Mt, down by -1.4% YoY
Italy - Produced 2.1 Mt, down by -4.1% YoY
- Middle East
Turkey - 3.3 Mt, up by 9.7% YoY
Iran - 1.9 Mt, up by almost 9% YoY
- US - Produced 7 Mt, up by 0.2% YoY
- Brazil - Produced 2.9 Mt, up by 13.2% YoY
April
- World - Crude steel production reached 142.1 million tons (Mt) in
April 2017, up by 5.0% over April 2016 (YoY)
- Asia
China - Crude steel production was 72.8 Mt, up by 4.9% YoY.
Japan - Produced 8.8 Mt, up by 3.0% YoY
- EU
Germany - Produced 3.9 Mt, up by 8.1% YoY
Italy - Produced 2.0 Mt, down by -6.0% YoY
- Middle East
Turkey - 3.0 Mt, up by 6.5% YoY
- US - Produced 6.7 Mt, up by 1.8% YoY
- Brazil - Produced 2.9 Mt, up by 25.9% YoY
March
- World - Crude steel production reached 145 million tons (Mt) in
March 2017, up by 4.6% over March 2016 (YoY).
World crude steel production was 410.5 Mt in the first three months of 2017, up by 5.7% YoY.
- Asia - produced 280.6 Mt of crude steel, an increase of 5.4% YoY.
China - Crude steel production was 72 Mt, up by 1.8% YoY.
Japan - Produced 8.93 Mt, up by 1.8% YoY
- EU - produced 42.5 Mt of crude steel in the first quarter of 2017, up by 3.8% YoY
Germany - Produced 3.9 Mt, up by 1.9% YoY
Italy - Produced 2.2 Mt, an increase of 9.5% YoY
- Middle East
Turkey - 3.1 Mt, up by 14% YoY
Iran - 1.58 Mt, up by 18.26 pct YoY
- CIS - produced 25.9 Mt of crude steel in the first three months of 2017, an increase of 4.0%
- US - Produced 7 Mt, up by 3.4% YoY
- Brazil - Produced 2.9 Mt, up by 13.7% YoY
February
- World - Crude steel production reached 126.6 million tons (Mt) in
February 2017, up by 4.1% over February 2016 (YoY).
- Asia
China - Crude steel production was 61.2 Mt, up by 4.6% YoY.
Japan - Produced 8.3 Mt, down by -0.1% YoY
- EU
Germany - Produced 3.5 Mt, up by 2.6% YoY
Italy - Produced 2 Mt, an increase of 1.2% YoY
- Middle East
Turkey - 2.7 Mt, up by 15.7% YoY
Iran - 1.37 Mt, up by 1.1 pct YoY
- US - Produced 6.4 Mt, up by 1.0% YoY
- Brazil - Produced 2.6 Mt, up by 5.7% YoY
January
- World - Crude steel production reached 136.5 million tons (Mt) in
January 2017, up by 7.0% over January 2016 (YoY).
- Asia
China - Crude steel production was 67.2 Mt, up by 7.4% YoY.
Japan - Produced 9 Mt, up by 2.7% YoY
- EU
Germany - Produced 3.6 Mt, up by 1.2% YoY
Italy - Produced 1.8 Mt, an increase of 0.3% YoY
- Middle East
Turkey - 2.9 Mt, up by 12.8% YoY
Iran - 1.52 Mt, up by 11.36 pct YoY
- CIS
Russia - Produced 6.2 Mt, up by 11.6% YoY
Ukraine - Produced 2.1 Mt, up by 8.5% YoY
- US - Produced 6.9 Mt, up by 6.5% YoY
- Brazil - Produced 2.9.2 Mt, up by 14.4%% YoY
Crude Steel Production Statistics Archive:
2005,
2006,
2007,
2008,
2009,
2010,
2011,
2012,
2013,
2014,
2015,
2016,
2017,
2018,
Other Middle East Production Statistics
Source: World Steel Association