In thousands of metric tons
|
Countries |
Jan |
Feb |
Mar |
Apr |
May |
Jun |
Jul |
Aug |
Sep |
Oct |
Nov |
Dec |
2016 Total |
2015 Total |
% Change |
|
Algeria |
- |
- |
- |
- |
- |
- |
- |
- |
- |
- |
- |
- |
- |
- |
- |
|
Egypt |
387 |
346 |
424 |
352 |
386 |
377 |
448 |
433 |
475 |
445 |
428 |
536 |
5037 |
5506 |
-8.52 |
|
Iran |
1365 |
1360 |
1336 |
1509 |
1645 |
1534 |
1351 |
1520 |
1588 |
1594 |
1570 |
1521 |
17,893 |
16,110 |
11.07 |
|
Libya |
76 |
52 |
43 |
56 |
48 |
29 |
27 |
31 |
15 |
19 |
45 |
50 |
491 |
352 |
39.49 |
|
Morocco |
22 |
45 |
41 |
33 |
49 |
45 |
45 |
45 |
45 |
50 |
50 |
50 |
520 |
516 |
0.78 |
|
Qatar |
199 |
206 |
243 |
211 |
235 |
178 |
218 |
232 |
225 |
187 |
171 |
216 |
2521 |
2593 |
-2.78 |
|
Saudi Arabia |
416 |
402 |
432 |
427 |
477 |
507 |
477 |
483 |
461 |
438 |
496 |
445 |
5461 |
5662 |
-3.55 |
|
Turkey |
2598 |
2370 |
2729 |
2842 |
2996 |
2822 |
2617 |
2809 |
2655 |
2975 |
2912 |
2838 |
33,163 |
31,516 |
5.23 |
|
UAE |
281 |
255 |
269 |
241 |
223 |
213 |
281 |
266 |
192 |
300 |
303 |
325 |
3149 |
3004 |
4.83 |
|
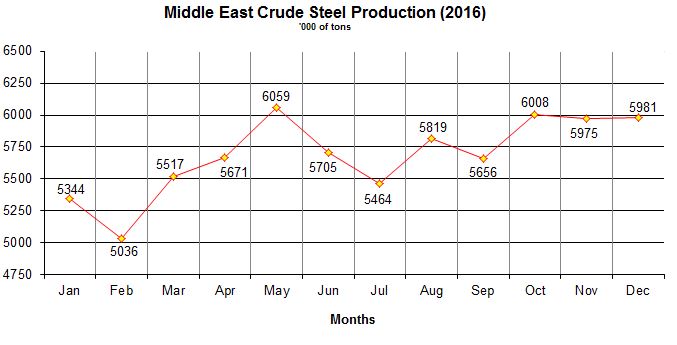
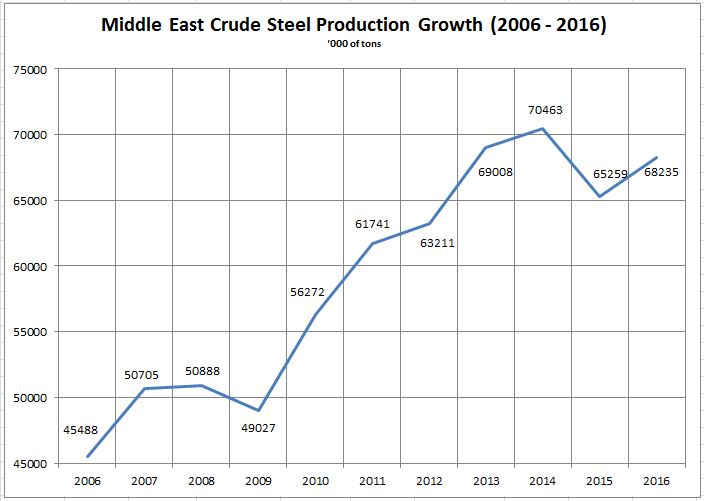
Total |
5.344 |
5.036 |
5.517 |
5.671 |
6,059 |
5,705 |
5,464 |
5,819 |
5,656 |
6,008 |
5,975 |
5,981 |
68.235 |
65,259 |
4.56 |
Algeria is not reporting any statistics to WSA since 2015
Monthly Middle East Steel Production Difference (December 2015 vs. December 2016)
| Country |
Dec-15 |
Dec-16 |
% Change |
| Egypt |
444 |
536 |
20.72 |
| Iran |
1300 |
1521 |
17.00 |
| Libya |
60 |
50 |
-16.67 |
| Morocco |
30 |
50 |
66.67 |
| Qatar |
197 |
216 |
9.64 |
| S. Arabia |
405 |
445 |
9.88 |
| Turkey |
2671 |
2838 |
6.25 |
| UAE |
262 |
325 |
24.05 |
| Total |
5369 |
5981 |
11.40 |
Quarterly Middle East Steel Production Difference (Q4-2015 vs. Q4-2016)
| Countries |
Q4-15 |
Q4-16 |
% Change |
| Egypt |
1171 |
1409 |
20.32 |
| Iran |
3879 |
4685 |
20.78 |
| Libya |
111 |
114 |
2.70 |
| Morocco |
90 |
150 |
66.67 |
| Qatar |
605 |
574 |
-5.12 |
| S. Arabia |
1195 |
1379 |
15.40 |
| Turkey |
8048 |
8725 |
8.41 |
| UAE |
784 |
928 |
18.37 |
| Total |
15883 |
17964 |
13.10 |
December
- World - Crude steel production reached 1,628.5 million tonnes (Mt) for the year 2016, up by 0.8% compared to 2015.
Production decreased in Europe, the Americas & Africa while it increased in the CIS, the Middle East, Asia and Oceania.
- Asia -Pproduction for Asia was 1,125.1 Mt of crude steel in 2016, an increase of 1.6% compared to 2015.
China - China’s share of world crude steel production increased from 49.4% in 2015 to 49.6% in 2016.
India - Produced 95.6 Mt, up by 7.4% YoY
Japan - Produced 104.8 Mt, down by -0.3% YoY
S. Korea- Produced 68.6 Mt, a decrease of -1.6% YoY
- EU - EU (28) produced 162.3 Mt of crude steel, a decrease of -2.3% compared to 2015
Germany - Produced 42.1 Mt of crude steel in 2016, down by -1.4% YoY
Italy - Produced 23.3 Mt in 2016, an increase of 6.0% YoY
- Middle East
Turkey - 33.1 Mt, up by 5.23% YoY
Iran - 17.9 Mt, up by 11 pct YoY
- CIS - Produced 102.4 Mt in 2016, 0.8% higher YoY
Russia - Produced 70.8 Mt of crude steel in 2016, down by -0.1% YoY
Ukraine - Produced 24.2 Mt of crude steel, up by 5.5% YoY
- US - Produced 78.6 Mt of crude steel, down by -0.3% YoY
- Brazil - Produced 30.2 Mt in 2016, down by -9.2%% YoY
November
- World - Crude steel production reached 132.4 million tons (Mt) in
November 2016, up by 5.0% over November 2015 (YoY).
- Asia
China - Crude steel production was 66.3 Mt, up by 5.0% YoY
Japan - Produced 8.6 Mt, down by -1.4% YoY
- EU
Germany - Produced 3.35 Mt of crude steel, down by -4.2% YoY
- Middle East
Turkey - 2.9 Mt, up by 10.4% YoY
Iran - 1.6 Mt, up by 26 pct YoY
- CIS
Russia - Produced 6 Mt of crude steel, up by 5% YoY
Ukraine - Produced 2 Mt of crude steel, up by 3.1% YoY
- US - Produced 6.2 Mt of crude steel, up by 6.8% YoY
- Brazil - Produced 2.4 Mt of crude steel, down by -4.8% YoY
October
- World - Crude steel production reached 136.5 million tons (Mt) in
October 2016, up by 3.3% over October 2015 (YoY).
- Asia
China - Crude steel production was 68.5 Mt, up by 4% YoY
India - Produced 8.3 Mt, up by 12.3% YoY
Japan - Produced 9 Mt, up by 0.6% YoY
- EU
Germany - Produced 3.5 Mt of crude steel, down by -3.7% YoY
- Middle East
Turkey - 3 Mt, up by 8.6% YoY
Iran - 1.64 Mt, up by 24 pct YoY
- CIS
Russia - Produced 5.9 Mt of crude steel, up by 2.0% YoY
Ukraine - Produced 1.9 Mt of crude steel, down by -6.1% YoY
- US - Produced 6.4 Mt of crude steel, down by -2.5% YoY
- Brazil - Produced 2.7 Mt of crude steel, down by -8.8% YoY
September
- World - Crude steel production reached 132.9 million tons (Mt) in
September 2016, up by 2.0% over September 2015 (YoY).
- Asia - In the first 9 months of 2016, Asia produced 825.9 Mt of crude steel, up by 0.6% YoY
China - Crude steel production was 68.2 Mt, up by 3.9% YoY
India - Produced 7.1 Mt
Japan - Produced 8.4 Mt, down by -1.5% YoY.
- EU - Produced 121.3 Mt of crude steel during the first 9 months of 2016, down by -4.8% YoY
Germany - Produced 3.2 Mt of crude steel, down by -3.9% YoY
- Middle East
Turkey - 2.7 Mt, up by 8.1% YoY
Iran - 1.6 Mt, up by 18.75 pct YoY
- CIS - Produced 76.4 Mt of crude steel in the first 9 months of 2016, a decrease of -0.1% YoY
Russia - Produced 5.7 Mt of crude steel, down by -2.1% YoY
Ukraine - Produced 1.9 Mt of crude steel, down by -8.0% YoY
- US - Produced 6.3 Mt of crude steel, down by -3.8% YoY
- Brazil - Produced 2.6 Mt of crude steel, up by 3.1% YoY
August
- World - Crude steel production reached 134.1 million tons (Mt) in
August 2016, up by 1.9% over August 2015 (YoY).
- Asia
China - Crude steel production was 68.6 Mt, up by 3% YoY
India - Produced 8.1 Mt, up by 9.4.1% YoY.
Japan - Produced 8.9 Mt, up by 1.5% YoY.
- EU
Germany - Produced 3.5 Mt of crude steel, up by 2.4% YoY
- Middle East
Turkey - 2.9 Mt, up by 12.9% YoY
Iran - 1.35 Mt, up by 8 pct YoY
- CIS
Russia - Produced 5.9 Mt of crude steel, down by -1.9% YoY
Ukraine - Produced 1.8 Mt of crude steel, down by -4.1% YoY
- US - Produced 6.7 Mt of crude steel, down by -3.4% YoY
- Brazil - Produced 2.7 Mt of crude steel, down by -1.1% YoY
July
- World - Crude steel production reached 133.7 million tons (Mt) in
July 2016, up by 1.4% over July 2015 (YoY).
- Asia
China - Crude steel production was 66.8 Mt, up by 2.8% YoY
India - Produced 8.1 Mt, up by 8.1% YoY.
Japan - Produced 8.9 Mt, up by 0.5% YoY.
- EU
Germany - Produced 3.4 Mt of crude steel, down by -6.1% YoY
- Middle East
Turkey - 2.7 Mt, up by 6.5% YoY
Iran - 1.35 Mt, up by 6.13 pct YoY
- CIS
Russia - Produced 6.1 Mt of crude steel, up by 0.9% YoY
Ukraine - Produced 2.1 Mt of crude steel, up by 10.5% YoY
- US - Produced 6.9 Mt of crude steel, down by -2.2% YoY
- Brazil - Produced 2.7 Mt of crude steel, down by -6% YoY
June
- World - Crude steel production reached 136 million tons (Mt) in
June 2016, same as May 2015 (YoY). In H1-2016, it was 794.8 Mt, a decrease of -1.9% YoY
- Asia - Crude steel production declined by -1.0%
China - Crude steel production was 69.5 Mt, up by 1.7% YoY
Japan - Produced 8.8 Mt, up by 2.7% YoY.
- EU - Production decreased by -6.1% in the EU 28
Germany - Produced 3.7 Mt of crude steel, down by -2.1% YoY
Italy - Produced 2 Mt of crude steel, up by 5.9% YoY
- Middle East - reported negative growth of -3.2% in H1-2016
Turkey - 2.9 Mt, up by 2% YoY
Iran - 1.59 Mt, up by more than 11.35 pct YoY
- CIS - showed an increase of 0.6% in H1-2016
Russia - Produced 5.8 Mt of crude steel, up by 2.5% YoY
Ukraine - Produced 1.8 Mt of crude steel, down by -8.6% YoY
- US - Produced 6.8 Mt of crude steel, down by -0.1% YoY
- Brazil - Produced 2.5 Mt of crude steel, down by -8.5% YoY
May
- World - Crude steel production reached 139 million tons (Mt) in
May 2016, a decrease of -0.1% over May 2015 (YoY).
- Asia
China - Crude steel production was 70.5 Mt, up by 1.8% YoY
Japan - Produced 8.8 Mt, down by -0.9% YoY.
- EU
Germany - Produced 3.9 Mt of crude steel, up by 4.0% YoY
Italy - Produced 2.2 Mt of crude steel, up by 9.3% YoY
- Middle East
Turkey - 3 Mt, up by 5.37% YoY
Iran - 1.65 Mt, up by more than 13 pct YoY
- CIS
Russia - Produced 6.0 Mt of crude steel, up by 0.4% YoY
Ukraine - Produced 2.3 Mt of crude steel, up by 5.7% YoY
- US - Produced 6.8 Mt of crude steel, down by -0.4% YoY
- Brazil - Produced 2.6 Mt of crude steel, down by -13.2% YoY
April
- World - Crude steel production reached 135 million tons (Mt) in
April 2016, a decrease of -0.5% over April 2015 (YoY).
- Asia
China - Crude steel production was 69.4 Mt, up by 0.5% YoY
Japan - Produced 8.5 Mt, up by -1.2% YoY.
- EU
Germany - Produced 3.6 Mt of crude steel, a decrease
of -1.5% YoY
Italy - Produced 2.1 Mt of crude steel, up by 14 .5% YoY
- Middle East
Turkey - 2.9 Mt, up by 5.3% YoY
Iran - 1.5 Mt, up by nearly 7.86 pct YoY
- CIS
Russia - Produced 5.9 Mt of crude steel, down by -0.4% YoY
Ukraine - Produced 2.2 Mt of crude steel, up by 11.7% YoY
- US - Produced 6.6 Mt of crude steel, up by 2.5% YoY
- Brazil - Produced 2.3 Mt of crude steel, down by -20.6% YoY
March
- World - Crude steel production reached 137 million tons (Mt) in
March 2016, a decrease of -0.5% over March 2015 (YoY).
World crude steel production was 385.7 Mt in Q1 2016, down by -3.6% compared to Q1 2015
- Asia - Produced 263.6 Mt of crude steel, a decrease of -3.1% over the Q1 2015
China - Crude steel production was 70.7 Mt, up by 2.9% YoY
Japan - Produced 8.6 Mt, down by -6.8% YoY.
India - Produced 8.1 Mt, up by 3.4% YoY.
- EU - Produced 40.9 Mt of crude steel in Q1-2016, down by -7.0% over Q1 2015
Germany - Produced 3.8 Mt of crude steel, a decrease
of -1.6% YoY
Italy - Produced 2 Mt of crude steel, down by -3.5% YoY
- Middle East - Produced 1.58 Mt in Q1 2016, down by -3.46 over Q1 2015
Turkey - 2.7 Mt, up by 1.3% YoY
Iran - 1.45 Mt, up by nearly 10.65 pct YoY
- CIS - Produced 25.0 Mt of crude steel in Q1 2016, a decrease of -0.4% over Q1 2015
Russia - Produced 6 Mt of crude steel, down by -2.0% YoY
Ukraine - Produced 2.2 Mt of crude steel, up by 28.1% YoY
- US - Produced 6.7 Mt of crude steel, up by 4.9% YoY
- Brazil - Produced 2.5 Mt of crude steel, down by -9.5% YoY
February
- World - Crude steel production reached 120 million tons (Mt) in
February 2016, a decrease of -3.3% over February 2015 (YoY).
- Asia
China - Crude steel production was 58.5 Mt, down by -4.0% YoY
Japan - Produced 8.4 Mt, down by -1.0% YoY.
- EU
Germany - Produced 3.4 Mt of crude steel, a decrease
of -4.3% YoY
Italy - Produced 1.9 Mt of crude steel, down by -2.1% YoY
- Middle East
Turkey - 2.4 Mt, up by 4.0% YoY
Iran - 1.36 Mt, down by -3.48 pct YoY
- CIS
Russia - Produced 5.7 Mt of crude steel, down by -2.7% YoY
Ukraine - Produced 2.0 Mt of crude steel, up by -24.1% YoY
- US - Produced 6.4 Mt of crude steel, up by 2.9% YoY
- Brazil - Produced 2.4 Mt of crude steel, down by -8.7% YoY
January
- World - Crude steel production reached 128 million tons (Mt) in
January 2016, a decrease of -7.1% over January 2015 (YoY).
-
Asia
China - Crude steel production was 63.2 Mt, down by -7.8% YoY
India - Produced 7.4 Mt, down by -1.2% YoY.
Japan - Produced 8.8 Mt, down by -2.8% YoY.
S. Korea - Produced 5.7 Mt, down by -4.5% YoY.
- EU
Germany - Produced 3.6 Mt of crude steel, a decrease
of -2.0% YoY
Italy - Produced 1.8 Mt of crude steel, down by -5.3% YoY
- Middle East
Turkey -
2.6 Mt, up by 0.8% YoY
Iran - 1.3 Mt apporximately - CIS
Russia - Produced 5.6 Mt of crude steel, down by -10.6% YoY
Ukraine - Produced 1.9 Mt of crude steel, down by -3.6% YoY
- US - Produced 6.6 Mt of crude steel, down by -8.8% YoY
Crude Steel Production Statistics Archive:
2005,
2006,
2007,
2008,
2009,
2010,
2011,
2012,
2013,
2014,
2015,
2016,
Other Middle East Production Statistics
Source: World Steel Association