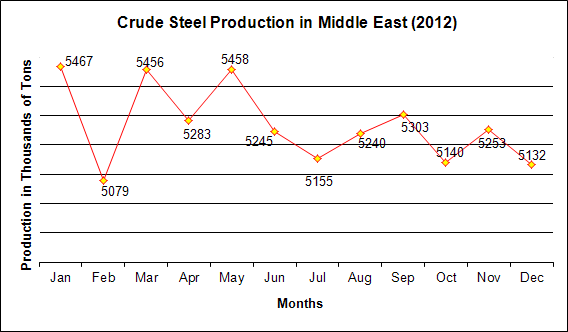
In thousands of metric tons
|
Countries |
Jan |
Feb |
Mar |
Apr |
May |
Jun |
Jul |
Aug |
Sep |
Oct |
Nov |
Dec |
2012
Total |
|
Algeria |
65 |
65 |
63 |
32 |
58 |
43 |
32 |
24 |
38 |
59 |
12 |
15 |
506 |
|
Egypt |
513 |
535 |
592 |
586 |
554 |
552 |
544 |
535 |
541 |
540 |
548 |
587 |
6.627 |
|
Iran |
1.234 |
1.229 |
1.163 |
1.297 |
1.242 |
1.225 |
1.122 |
1.142 |
1.232 |
1.166 |
1.222 |
1.189 |
14.463 |
|
Libya* |
- |
- |
- |
- |
- |
- |
- |
- |
- |
- |
- |
- |
- |
|
Morocco |
56 |
55 |
52 |
44 |
60 |
36 |
36 |
47 |
30 |
27 |
41 |
45 |
529 |
|
Qatar* |
- |
- |
- |
- |
- |
- |
- |
- |
- |
- |
- |
- |
- |
|
Saudi Arabia |
464 |
432 |
462 |
439 |
463 |
448 |
282 |
447 |
410 |
467 |
437 |
451 |
5.202 |
|
Turkey |
3.135 |
2.763 |
3.124 |
2.885 |
3.081 |
2.941 |
3.139 |
3.045 |
3.052 |
2.881 |
2.993 |
2.845 |
35.884 |
|
Total |
5.467 |
5.079 |
5.456 |
5.283 |
5.458 |
5.245 |
5.155 |
5.240 |
5.303 |
5.140 |
5.253 |
5.132 |
63.211 |


Annual Difference (2012 to 2011)
|
Countries |
2011 |
2012 |
% Change |
|
Algeria |
440 |
506 |
15.00 |
|
Egypt |
6487 |
6627 |
2.16 |
|
Iran |
13038 |
14463 |
10.93 |
|
Libya |
100 |
0 |
0 |
|
Morocco |
290 |
529 |
82.41 |
|
Qatar |
2008 |
0 |
0 |
|
S. Arabia |
5275 |
5202 |
-1.38 |
|
Turkey |
34103 |
35884 |
5.22 |
|
Total |
61741 |
63211 |
2.38 |
Half-Yearly Difference (H1-2012 to H1-2011)
|
Countries |
H1-11 |
H1-12 |
%Change |
H2-11 |
H2-12 |
%Change |
|
Algeria |
200 |
326 |
63.00 |
240 |
180 |
-33.33 |
|
Egypt |
3249 |
3332 |
2.55 |
3238 |
3295 |
1.73 |
|
Iran |
6633 |
7390 |
11.41 |
6405 |
7073 |
9.44 |
|
Libya |
100 |
0 |
0 |
0 |
0 |
0 |
|
Morocco |
140 |
303 |
116.43 |
150 |
226 |
33.63 |
|
Qatar |
998 |
0 |
0 |
1010 |
0 |
0 |
|
S. Arabia |
2725 |
2708 |
-0.62 |
2550 |
2494 |
-2.25 |
|
Turkey |
16404 |
17929 |
9.30 |
17699 |
17955 |
1.43 |
|
Total |
30449 |
31988 |
5.05 |
23704 |
31223 |
24.08 |
Note:
*Libya & Qatar data is no more reported by WSA

Top 10 steel-producing countries
| Rank | Country | 2012 (Mt) | 2011 (Mt) | 2012/2011(%) |
| 1 | China | 716.5 | 694.8 | 3.1 |
| 2 | Japan | 107.2 | 107.6 | -0.3 |
| 3 | United States | 88.6 | 86.4 | 2.5 |
| 4 | India | 76.7 | 73.6 | 4.3 |
| 5 | Russia | 70.6 | 68.9 | 2.5 |
| 6 | South Korea | 69.3 | 68.5 | 1.2 |
| 7 | Germany | 42.7 | 44.3 | -3.7 |
| 8 | Turkey | 35.9 | 34.1 | 5.2 |
| 9 | Brazil | 34.7 | 35.2 | -1.5 |
| 10 | Ukraine | 32.9 | 35.3 | -6.9 |
December
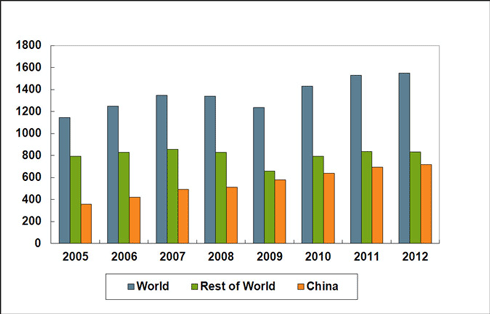
- World - Crude steel production reached 1,548 megatonnes (Mt) for
the year 2012, up by 1.2% compared to 2011 (YoY)
-
Asia - Annual production for Asia was 1,012.7 Mt of crude steel in
2012, an increase of 2.6% YoY.
Regionís share of world steel production increased slightly from 64.5% in
2011 to 65.4% in 2012
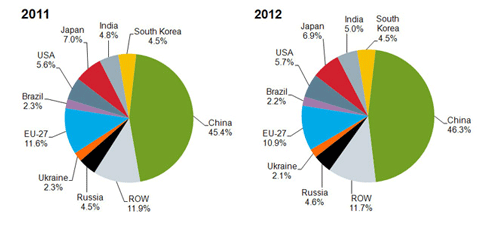
China - Crude steel production
in 2012 reached 716.5 Mt, an increase of 3.1% YoY.
Share of world crude steel production increased from 45.4% in 2011 to 46.3%
in 2012
Japan - Produced 107.2 Mt in 2012, a -0.3%
decrease YoY.
S. Korea - Crude steel production was
69.3 Mt, a 1.2% increase YoY
- EU -
Eecorded a decrease of -4.7% compared to 2011, producing 169.4 Mt of
crude steel in 2012
France - Produced 15.6 Mt in 2012, a decrease of -1.1% YoY
Germany - Produced 42.7 Mt of crude steel in 2012, a
decrease of -3.7% YoY
Italy - Produced 27.2 Mt in 2012, a -5.2% decrease YoY
Spain - Produced 13.6 Mt of crude steel in 2012, a -12.1%
decrease YoY
- Middle East
Turkey -
Produced 35.9 Mt, an increase of 5.2% YoY.
- CIS - Showed a decrease of -1.2% in 2012, producing 111.3 Mt of
crude steel
Russia - Produced 68.9 Mt of crude steel in 2012, a
2.5% increase YoY
Ukraine - Produced 32.9 Mt of crude steel in 2012, down by
-6.9% YoY
- Others
US - Produced 88.6 Mt of crude
steel, 2.5% higher YoY
Brazil - Produced 34.7 Mt
in 2012, down by -1.5% YoY
November
- World - crude steel production was 122 million tonnes in November
2012, an increase of 5.1% YoY.
-
Asia
China - Crude steel production reached
57.5 Mt, up by 13.7% YoY.
Japan - Produced 8.5 Mt, down by -2.3% YoY.
S. Korea
- Crude steel production was 5.6 Mt, down by -2.7% YoY
- EU
France - Produced 1.3 Mt, a decrease of -5.4 YoY
Germany - Produced 3.4 Mt, a
-0.2% decrease YoY
Italy - Produced 2.2 Mt, down by -12.9% YoY
Spain - Produced 1.0 Mt of crude steel, a -14.2%
decrease YoY
- Middle East
Turkey -
Produced 3.0 Mt, an increase of 4.6% YoY.
- CIS
Russia - Produced 5.5 Mt of crude steel, a decrease
of -0.7% YoY
Ukraine - Produced 2.7 Mt of crude steel, down by
-7.9% YoY
- Others
US - Produced 6.7 Mt, down by
-4.8% YoY
Brazil - Produced 2.8 Mt, an increase
of 2.4% YoY
October
- World - Crude steel production was 126 million tons (Mt) in
October 2012, an increase of 1.3% YoY.
-
Asia
China - Crude steel production reached
59.1 Mt, up by 6.0% YoY.
Japan - Produced 8.8 Mt, a
decrease of -6.7% YoY.
- EU
France - Produced 1.3 Mt, a decrease of -7.2% YoY
Germany - Produced 3.7 Mt, a slight increase of 0.3% YoY
Italy - Produced 2.4 Mt, down by -10.4% YoY
Spain - Produced 1.1 Mt of crude steel, down by -15.6% YoY
- Middle East
Turkey -
Produced 2.9 Mt, a decrease of -6.9% YoY.
- Others
US - Produced 6.9 Mt, down by
-3.3% YoY
Brazil - Produced 3.2 Mt, an increase
of 7.7% YoY
September
- World - crude steel production was 1,149 Mt in the first nine
months of 2012, an increase of 0.6% compared to the same months of 2011.
Crude steel production reached 124 million tons (Mt) in Sept. 2012, no
change compared to September 2011 (YoY).
-
Asia produced 748.6 Mt of crude steel in the first nine months of
2012, an increase of 1.5% YoY.
China - Crude steel production reached
58 Mt, up by 0.6% YoY.
Japan - Produced 8.8 Mt, down by -1.0 % YoY.
S. Korea - Crude steel production was 5.6 Mt, a 1.8% increase YoY
- EU
produced 129.6 Mt of crude steel in the first three quarters of 2012,
down by -4.6% YoY.
France - Produced 1.3 Mt, a
-3.0% decrease YoY
Germany - Produced 3.6 Mt, a
-2.2% decrease YoY
Italy - Produced 2.4 Mt, down by
-7.8% YoY
Spain - Produced 1.2 Mt of crude steel, a - 10.3%
decrease YoY
- Middle East
Turkey -
3.0 Mt, up by 1.9% YoY.
- CIS produced 84.7 Mt of crude steel in the first nine months of
2012, up by 0.3% YoY
Russia - Produced 6.2 Mt of crude steel, up by 15.1% YoY
Ukraine - Produced 2.7 Mt of crude steel, down by
-8.3% YoY
- Others
US - Produced 7.0 Mt of crude steel, -3.0% higher YoY
Brazil - Produced 2.8 Mt of crude steel, a -0.4% decrease YoY
August
- World - Crude steel production reached 124 million tons (Mt) in
August 2012, an decrease of -1.0% compared to August 2011.
-
Asia
China - Crude steel production reached
58.7 Mt, down by -1.7% YoY.
Japan - Produced 9.2 Mt, up 3.3 % YoY.
S. Korea - Crude steel production was 5.7 Mt, a 2.8% increase YoY
- EU
France - Produced 1.0 Mt, a
-7.2% decrease YoY
Germany - Produced 3.4 Mt, a
-7.1% decrease YoY
Italy - Produced 1.2 Mt, down by
-15.5% YoY
Spain - Produced 1.0 Mt of crude steel, a - 10.3%
decrease YoY
- Middle East
Turkey -
3.0 Mt, up by 8.7% YoY.
- CIS
Russia - Produced 5.8 Mt of crude steel, up by 1.8% YoY
Ukraine - Produced 2.7 Mt of crude steel, down by
-13.5% YoY
- Others
US - Produced 7.5 Mt of crude steel, 1.2% higher YoY
Brazil - Produced 2.8 Mt of crude steel, a -6.2% decrease YoY
July
- World - Crude steel production reached 130 million tons (Mt) in
July 2012, an increase of 2.0% compared to July 2011.
-
Asia
China - Crude steel production reached
61.7 Mt, an increase of 4.2% YoY.
Japan - Produced 9.3 Mt, up 1.2 % YoY.
S. Korea - Crude steel production was 5.9 Mt, a 4.4% increase YoY
- EU
Germany - Produced 3.6 Mt, a
-2.1% decrease YoY
Spain - Produced 1.0 Mt of crude steel, 7% higher YoY
- Middle East
Turkey -
3.1 Mt, up by 9.7% YoY.
- Others
US - Produced 7.4 Mt of crude steel, 0.9% higher YoY
Brazil - Produced 3 Mt of crude steel, a -4.1% decrease YoY
June
- World - Crude steel production reached 128 million tons (Mt) in
June 2012, a decrease of -0.1% compared to June 2011.
World crude steel production in the first six months of 2012 was 766.9 Mt, a
slight increase of 0.9% compared to the same period of 2011.
North America and Asia showed an increase of 7.2% and 1.6% respectively (USA
8.4% and China 1.8%) while the EU (27) and
South America recorded negative growth of -4.6% and -3.5% each.
-
Asia
China - Crude steel production reached
60.2 Mt, an increase of 0.6% YoY.
Japan - Produced 9.2 Mt, up 3.5 % YoY.
S. Korea - Crude steel production was 5.9 Mt, a 4.3% increase YoY
- EU
Germany - Produced 3.7 Mt, a
-4.0% decrease YoY
Italy - Produced 2.4 Mt, a
-739% decrease YoY
France - Produced 1.3 Mt of crude steel, down by -2.1% on YoY
Spain - Produced 1.3 Mt of crude steel, a
-8.8% decrease YoY
- Middle East
Turkey -
2.9 Mt, up by 4.0% YoY.
- Others
US - Produced 7.3 Mt of crude steel, 0.8% higher YoY
Brazil - Produced 2.7 Mt of crude steel, a -8.5% decrease YoY
May
- World - Crude steel production reached 131 million tons (Mt) in
May 2012, an increase of 0.7% than May 2011.
-
Asia
China - Crude steel production reached
61.2 Mt, an increase of 2.5% YoY.
Japan - Produced 9.2 Mt, up 2.0 % YoY.
S. Korea - Crude steel production was 6 Mt, a 2.0% increase YoY
- EU
Germany - Produced 3.7 Mt, a
-9.7% decrease YoY
Italy - Produced 2.6 Mt, a
-3.3% decrease YoY
France - Produced 1.5 Mt of crude steel, up by 1.3% on YoY
Spain - Produced 1.3 Mt of crude steel, a
-13.9% decrease YoY
- Middle East
Turkey -
3.1 Mt, up by 6.6% YoY.
- Others
US - Produced 7.7 Mt of crude steel, 7.4% higher YoY
Brazil - Produced 2.9 Mt of crude steel, a -11.7% decrease YoY
April
- World - Crude steel production reached 128 million tons (Mt) in
April 2012, an increase of 1.2% than April 2011.
-
Asia
China - Crude steel production reached
60.6 Mt, an increase of 2.6% YoY.
Japan - Produced 9.1 Mt, up 7.6 % YoY.
S. Korea - Crude steel production was 6 Mt, a 2.1% increase YoY
- EU
Germany - Produced 3.6 Mt, a
-5.5% decrease YoY
Italy - Produced 2.4 Mt, a
-3.2% decrease YoY
France - Produced 1.4 Mt of crude steel, a decrease of -1.8% on YoY
Spain - Produced 1.3 Mt of crude steel, a
-14.3% decrease YoY
- Middle East
Turkey -
2.9 Mt, up by 4.7% YoY.
- Others
US - Produced 7.7 Mt of crude steel, 9.3% higher YoY
Brazil - Produced 3 Mt of crude steel, a -1.2% decrease YoY
March
- World - Crude steel production reached 132 million tons (Mt) in
March 2012, an increase of 1.8% than March 2011.
Production for the Q1-2012 was 377 Mt, 1.1% higher than Q1-2011
-
Asia - In Q1-2012, Asia produced 241.7 Mt of crude steel, an increase
of 1.5% over Q1-2011
China - Crude steel production reached
61.6 Mt, an increase of 3.9% YoY.
Japan - Produced 9.3 Mt, up 2.3 % YoY.
S. Korea - Crude steel production was 6 Mt, a 3.2% increase YoY
- EU -
In Q1-2012, EU produced 43.9 Mt of crude steel, down by -3.9% compared
to Q1-2011
Germany - Produced 3.9 Mt, a
-3.1% decrease YoY
France - Produced 1.5 Mt of crude steel, an
increase of 3.8% on YoY
Spain - Produced 1.3 Mt of crude steel, a
-19.5% decrease YoY
- Middle East
Turkey -
3.1 Mt, up by 14.5% YoY.
- Others
US - Produced 7.8 Mt of crude steel, 5.4% higher YoY
Brazil - Produced 3.1 Mt of crude steel, 2.2% higher YoY
February
- World - Crude steel production reached 119 million tons (Mt) in
February 2012, an increase of 1.9% than February 2011.
-
Asia
China - Crude steel production in Feb 2012
reached 55.9 Mt, an increase of 3.3% YoY.
Japan - Produced 8.6 Mt, a -3.7% decrease YoY.
S. Korea - Crude steel production was 5.4 Mt, a 7.6% increase YoY
- EU
Germany - Produced 3.6 Mt of crude steel in Feb-2012, a
-3.1% decrease YoY
France - Produced 1.3 Mt of crude steel in Feb-2012, an
increase of 9.3% on YoY
Spain - Produced 1.2 Mt of crude steel in
Feb-2012, a
-14.3% decrease YoY
- Middle East
Turkey -
2.8 Mt, up by 12.3% YoY.
- Others
US - Produced 7.3 Mt of crude steel, 8.5% higher YoY
Brazil - Produced 2.8 Mt of crude steel, 3.4% higher YoY
January
- World - Crude steel production reached 117 million tons (Mt) in
January 2012, a -7.8% lower than January 2011.
-
Asia
China - Crude steel production in Jan 2012
was 52.1 Mt, a decrease of -13% compared to January 2011.
Japan - Produced 8.6 Mt, a -10.6% decrease YoY.
S. Korea - Crude steel production was 5.1 Mt, a -9.6% decrease YoY
- EU
Germany - Produced 3.4 Mt of crude steel in Jan 2012, a
-8.5% decrease YoY
Italy - Produced 2.2 Mt of crude steel in Jan 2012, 4.6%
higher YoY
France - Produced 1.4 Mt of crude steel in Jan 2012, an
increase of 11.2% on YoY
- Middle East
Turkey -
3.1 Mt, up by 14.4% YoY.
Turkish crude steel production in January surpassed
3 mln tons for the first time, getting close to Europeís biggest producer
Germany (3.7 million tons).
- Others
Brazil - Produced 2.8 Mt of crude steel, 0.6% higher YoY
Russia - Produced 5.9 Mt of crude steel, 0.4% higher YoY
Ukraine - Produced 2.9 Mt of crude steel, a -1.6% decrease YoY
US - Produced 7.6 Mt of crude steel, 5.7% higher YoY
Crude Steel Production Statistics Archive:
2005,
2006,
2007,
2008,
2009,
2010,
2011, 2012
Other Middle East Production Statistics
Source: World Steel Association


