In thousands of metric tons
|
Countries |
Jan |
Feb |
Mar |
Apr |
May |
Jun |
Jul |
Aug |
Sep |
Oct |
Nov |
Dec |
|
Algeria |
35 |
30 |
35 |
35 |
35 |
35 |
35 |
35 |
35 |
35 |
35 |
35 |
|
Egypt |
542 |
521 |
561 |
594 |
460 |
684 |
510 |
612 |
268 |
494 |
581 |
658 |
|
Iran |
1141 |
1260 |
1329 |
1456 |
1422 |
1408 |
1290 |
1332 |
1429 |
1444 |
1459 |
1362 |
|
Libya |
77 |
84 |
85 |
72 |
82 |
78 |
80 |
80 |
80 |
85 |
80 |
85 |
|
Morocco |
58 |
39 |
61 |
51 |
42 |
32 |
38 |
60 |
1 |
51 |
57 |
11 |
|
Qatar |
206 |
211 |
266 |
254 |
255 |
256 |
270 |
270 |
269 |
278 |
242 |
270 |
|
Saudi Arabia |
543 |
488 |
540 |
505 |
545 |
490 |
522 |
543 |
486 |
543 |
538 |
547 |
|
Turkey |
2880 |
2727 |
2875 |
2653 |
3051 |
2975 |
2833 |
2907 |
2898 |
2720 |
2800 |
2715 |
|
UAE |
157 |
226 |
211 |
245 |
268 |
186 |
165 |
104 |
151 |
225 |
237 |
214 |
|
Total |
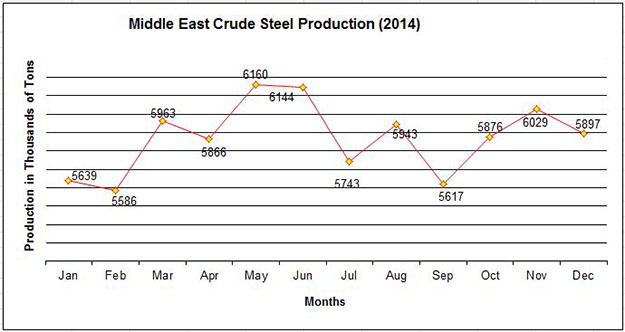
5.639 |
5.586 |
5.963 |
5.866 |
6.160 |
6.144 |
5.743 |
5.943 |
5.617 |
5.876 |
6.029 |
5.897 |
Annual Difference in Crude Seel Production (2014 vs. 2013)
| Countries |
2014 Total |
2013 Total |
% Change |
| Algeria |
415 |
439 |
-5.47 |
| Egypt |
6485 |
6754 |
-3.98 |
| Iran |
16332 |
15421 |
5.91 |
| Libya |
968 |
716 |
35.20 |
| Morocco |
502 |
558 |
-10.04 |
| Qatar |
3047 |
2236 |
36.27 |
| Saudi Arabia |
6290 |
5354 |
17.48 |
| Turkey |
34034 |
34654 |
-1.79 |
| UAE |
2390 |
2876 |
-16.90 |
| Total |
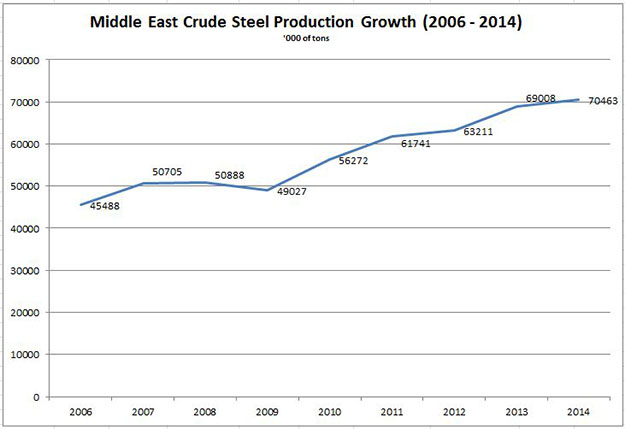
70.463 |
69.008 |
2.11 |
December
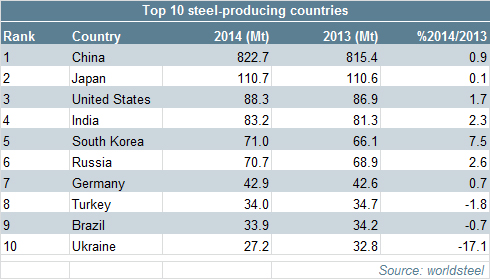
- World - Crude steel production reached 1,662 million tonnes (Mt) in 2014, up by 1.2% compared to 2013
- Asia - Annual production for Asia was 1,132.3 Mt of crude steel in 2014, an increase of 1.4% compared to 2013
China - Crude steel production was 822.7 Mt, an increase of 0.9% on 2013.
Japan - Produced 110.7 Mt in 2014, a 0.1% increase from 2013
S. Korea - Crude steel production was 71.0 Mt, an increase of 7.5% compared to 2013
- EU - Recorded an increase of 1.7% compared to 2013, producing 169.2 Mt of crude steel in 2014
Germany - Produced 42.9 Mt of crude steel in 2014, up by 0.7% over 2013
France - Produced 16.1 Mt, an increase of 2.9%
Italy - Produced 23.7 Mt in 2014, a -1.4% decrease over 2013
Spain - Produced 14.2 Mt of crude steel in 2013, a decrease of -0.6% compared to 2013
Middle East - In 2014, the Middle East had the most robust steel productin growth.
Turkey - Produced 34 Mt, down by -1.79% YoY
Iran - Produced 16.33 Mt, up by 5.91% YoY
- Others
US - Produced 88.3 Mt of crude steel, up by 1.7% compared to 201
November
- World - Crude steel production reached 131 million tonnes (Mt) in November 2014, an slight decrease of -0.1% compared to November 2013
- Asia
China - Crude steel production was 63.3 Mt, a slight decrease of -0.2% YoY.
Japan - Produced 9.2 Mt, down by -1.1% YoY.
S. Korea - Crude steel production was 5.9 Mt, up by 5.5% YoY
- EU
Germany - Produced 3.6 Mt of crude steel, a decrease
of -1.9% YoY
France - Produced 1.4 Mt of crude steel, up by 5.8% YoY
Italy - Produced 1.9 Mt of crude steel, down by -13.9% YoY
Spain - Produced 1.2 Mt of crude steel, down by -1.9% YoY
Middle East
Turkey - 2.8 Mt, down by -8.6% YoY
Iran - 1.46 Mt, up by approximately 6.1% YoY
- CIS
Russia - 5.8 Mt, up by 5.8% YoY
Ukraine - 1.8 Mt, down by -28.6% YoY
- Others
Brazil - Produced 2.8 Mt of crude steel, up by 2.4% YoY
US - Produced 7.2 Mt of crude steel, up by 1.5% YoY
October
- World - Crude steel production reached 137 million tonnes (Mt) in October 2014, same compared to October 2013
- Asia
China - Crude steel production was 67.5 Mt, a decrease of -0.3% YoY.
Japan - Produced 9.4 Mt, down by -0.5% YoY.
S. Korea - Crude steel production was 6.2 Mt, up by 4.5% YoY
- EU
Germany - Produced 3.5 Mt of crude steel, a decrease
of -5.9% YoY
- Middle East
Turkey - 2.7 Mt, down by -11% YoY
Iran - 1.44 Mt, up by approximately 4.8% YoY
- Others
Brazil - Produced 3.1 Mt of crude steel, up by 2.7% YoY
US - Produced 7.3 Mt of crude steel, down by -0.7% YoY
September
- World - Crude steel production reached 134 million tonnes (Mt) in September 2014, an slight decrease of -0.1% compared to September 2013
- Asia
China - Crude steel production was 67.5 Mt, same YoY.
Japan - Produced 9.2 Mt, down by -0.5% YoY.
S. Korea - Crude steel production was 5.7 Mt, up by 10.1% YoY
- EU
Germany - Produced 3.5 Mt of crude steel, a decrease
of -3.0% YoY
- Middle East
Turkey - 2.9 Mt, down by -3.1% YoY
Iran - 1.43 Mt, up by approximately 4.8% YoY
- Others
Brazil - Produced 2.9 Mt of crude steel, down by -3.8% YoY
US - Produced 7.3 Mt of crude steel, down by -0.1% YoY
August
- World - Crude steel production reached 135 million tonnes (Mt) in August 2014, an increase of 1.4% compared to August 2013
- Asia
China - Crude steel production was 68.9 Mt, up by 1.0% YoY.
Japan - Produced 9.3 Mt, up by 2.2% YoY.
S. Korea - Crude steel production was 5.3 Mt, up by 8.0% YoY
- EU
Germany - Produced 3.1 Mt of crude steel, a decrease
of -1.5% YoY
- Middle East
Turkey - 2.9 Mt, up by 13.9% YoY
Iran - 1.33 Mt, up by more than 3% YoY
- CIS
Russia - Produced 6.2 Mt of crude steel, up by 5.8% YoY
Ukraine - Produced 1.85 Mt of crude steel, down by -37% YoY
- Others
Brazil - Produced 2.9 Mt of crude steel, down by -1.4% YoY
US - Produced 7.7 Mt of crude steel, up by 2.9% YoY
July
- World - Crude steel production reached 137 million tonnes (Mt) in July 2014, an increase of 1.7% compared to July 2013
- Asia
China - Crude steel production was 68.3 Mt, up by 1.5% .
Japan - Produced 9.3 Mt, same YoY.
S. Korea - Crude steel production was 5.9 Mt, up by 6.2% YoY
- EU
Germany - Produced 3.4 Mt of crude steel, an increase
of 1.5% YoY
- Middle East
Turkey - 2.8 Mt, up by 1% YoY
Iran - 1.29 Mt
- Others
Ukraine - Produced 2.5 Mt of crude steel, down by -11.7% YoY
US - Produced 7.6 Mt of crude steel, up by 2.3% YoY
June
- World - Crude steel production reached 137 million tonnes (Mt) in June 2014, an increase of 3.1% compared to June 2013
In the first six months of 2014, world crude steel production was 821.3 Mt, an increase of 2.5% compared to the same period of 2013.
- Asia
China - Crude steel production was 69.3 Mt, up by 4.5% .
Japan - Produced 9.1 Mt, a decrease of -1.7% YoY.
S. Korea - Crude steel production was 6.0 Mt, up by 10.8% YoY
- EU
Germany - Produced 3.6 Mt of crude steel, an increase
of 0.6% YoY
Italy - Produced 2.1 Mt of crude steel, down by -3.7% YoY
- Middle East
Turkey - 3.1 Mt, up by 6.7% YoY
Iran - 1.375 Mt
- Others
Ukraine - Produced 2.6 Mt of crude steel, down by -6.0% YoY
US - Produced 7.2 Mt of crude steel, up by 1.9% YoY
May
- World - Crude steel production reached 141 million tonnes (Mt) in May 2014, an increase of 2.2% compared to May 2013
- Asia
China - Crude steel production was 70.4 Mt, up by 2.6% .
Japan - Produced 9.6 Mt, a decrease of -0.3% YoY.
S. Korea - Crude steel production was 6.2 Mt, up by 11.4% YoY
- EU
Germany - Produced 3.9 Mt of crude steel, an increase
of 7.3% YoY
Italy - Produced 2.3 Mt of crude steel, down by -0.8% YoY
- Middle East
Turkey - 3 Mt, down by -0.7% YoY
- Others
Russia - Produced 6.1 Mt of crude steel, up by 0.6% YoY
Ukraine - Produced 2.8 Mt of crude steel, up by 2.2% YoY
US - Produced 7.5 Mt of crude steel, up by 1.4% YoY
April
- World - Crude steel production reached 137 million tonnes (Mt) in April 2014, an increase of 1.7% compared to April 2013
- Asia
China - Crude steel production was 68.8 Mt, up by 2.1% .
Japan - Produced 8.9 Mt, a decrease of -2.5% YoY.
S. Korea - Crude steel production was 6.1 Mt, up by 10.8% YoY
- EU
Germany - Produced 3.7 Mt of crude steel, an increase
of 3.9% YoY
Italy - Produced 2 Mt of crude steel, down by -4% YoY
- Middle East
Turkey - 2.6 Mt, down by -9.1% YoY
- Others
Russia - Produced 5.8 Mt of crude steel, up by 0.7% YoY
Ukraine - Produced 2.6 Mt of crude steel, down by -4.5% YoY
US - Produced 7 Mt of crude steel, down by -1.6% YoY
March
- World - Crude steel production reached 141 million tonnes (Mt) in March 2014, an increase of 2.7% compared to March 2013
- Asia - In the first three months of 2014, Asia produced 274.0 Mt of crude steel, an increase of 2.6% over the first quarter of 2013
China - Crude steel production was 70.3 Mt, up by 2.2% .
Japan - Produced 9.7 Mt, a 2.9% increase YoY.
S. Korea - Crude steel production was 6.1 Mt, up by 8% YoY
- EU - The EU produced 43.8 Mt of crude steel in the first quarter of 2014, up by 6.7% compared to the same quarter of 2013
Germany - Produced 4 Mt of crude steel, an increase
of 6.1% YoY
Italy - Produced 2.4 Mt of crude steel, up by 8% YoY
- Middle East
Turkey - 2.8 Mt, down by -4.3% YoY
Iran - 1.4 Mt approximately.
- Others - The C.I.S. produced 26.3 Mt of crude steel in the first three months of 2014, a decrease of -2.8% over the same months of 2013
Russia - Produced 6 Mt of crude steel, up by 1.3% YoY
Ukraine - Produced 2.7 Mt of crude steel, down by -7.7% YoY
US - Produced 7.4 Mt of crude steel, up 0.9% YoY
February
- World - Crude steel production reached 125 million tonnes (Mt) in February 2014, an increase of 0.6% compared to February 2013
- Asia
China - Crude steel production was 62.1 Mt.
Japan - Produced 8.4 Mt, a 1.4% increase YoY.
S. Korea - Crude steel production was 5.3 Mt, up 6.2% YoY
- EU
Germany - Produced 3.6 Mt of crude steel, an increase
of 4.2% YoY
Italy - Produced 2.2 Mt of crude steel, up by 3.6% YoY
- Middle East
Turkey - 2.7 Mt, up by 0.7% YoY
Iran - 1.26 Mt.
- Others
Russia - Produced 5.3 Mt of crude steel, down by -3.1% YoY
Ukraine - Produced 2.3 Mt of crude steel, down by -10.7% YoY
US - Produced 6.73 Mt of crude steel, -1.7% lower YoY
January
- World - Crude steel production reached 130 million tons (Mt) in
January 2014, a decrease of -0.4% over January 2013.
-
Asia
China - Crude steel production was 687 Mt.
Japan - Produced 9.4 Mt, a 6.1% increase YoY.
S. Korea - Crude steel production was 6 Mt, up 1.9% YoY
- EU
Germany - Produced 3.7 Mt of crude steel, an increase
of 2.2% YoY
Italy - Produced 2.2 Mt of crude steel, up by 27.8% YoY
- Middle East
Turkey -
2.8 Mt, down by -0.9% YoY
Iran - 1.14 Mt.
- Others
Russia - Produced 5.9 Mt of crude steel, up by 4.1% YoY
Ukraine - Produced 2.5 Mt of crude steel, down by -13.5% YoY
US - Produced 7.3 Mt of crude steel, -0.5% lower YoY
Crude Steel Production Statistics Archive:
2005,
2006,
2007,
2008,
2009,
2010,
2011,
2012,
2013,
2014
Other Middle East Production Statistics
Source: World Steel Association